


 FxWirePro- Major Crypto levels and bias summary
  FxWirePro- Major Crypto levels and bias summary


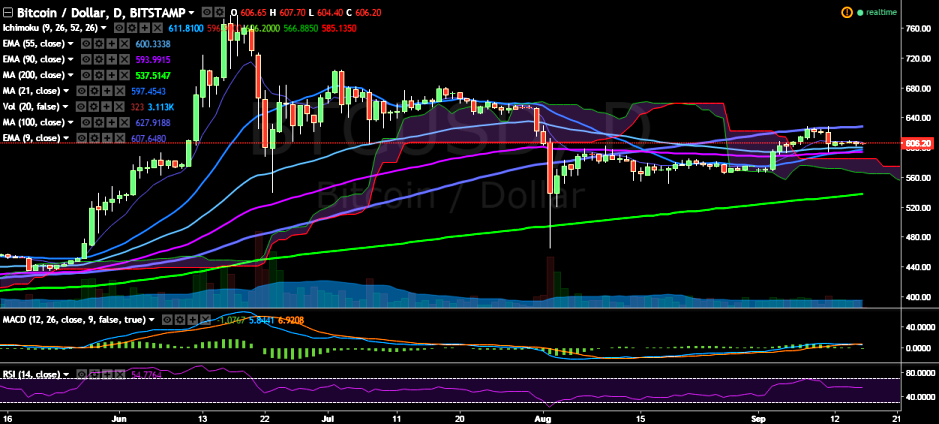
BTC/USD remained largely flat this week, trading in a narrow range between 600-610 levels. It is currently trading at 606.95 levels (Bitstamp).
Long-term trend: Bullish
Ichimoku analysis of daily chart:
Tenkan Sen: 611
Kijun Sen: 596.90
Trend reversal: 593.71 (90 EMA)
The pair’s uptrend is being capped by 9-EMA and it must break above for further jump. It faces major resistance at 627.68 (100-day) and a break above would see the pair testing 653.69 (78.6% retracement of 704.99 and 465.28)/ 705 (July 3 high).
On the flipside, the pair has been successfully holding above 600 levels. A break below would target 593.71 (90 EMA)/ 547.14 (50% retracement of 465.28 and 628.99)/ 536.65 (200-day MA).

- News

- Economy

- Central Banks
- Investing
- Research
- Roundups
- Digital Currency
- Insights
- Technical Analysis
- Technology
- Business
- Law
- Health
- Nature
- Fintech
- Science
- Topic
- Opinions
- ©Econometrics LLC . All Rights Reserved.
BTC/USD trades flat, bullishness only above 630
Friday, September 16, 2016 7:16 AM UTC
Editor's Picks


- Market Data
Most Popular


