


 JPY Action Bias: NZDJPY and AUDJPY Stand Out as the Most Bullish Pairs
  FxWirePro:EUR/NZD downside pressure builds, key support level in focus
  NZDJPY Bullish Above 95: Buy Dips Toward 97 as Kiwi Strength Holds Firm
  ETHUSD Breaks Above $1900 as Bulls Eye $2300 and Beyond
  Major Pair Action Bias: AUDUSD and NZDUSD Bullish While EURUSD Turns Bearish
  FxWirePro:GBP/AUD slips as markets assess Burnham's rise to UK premiership


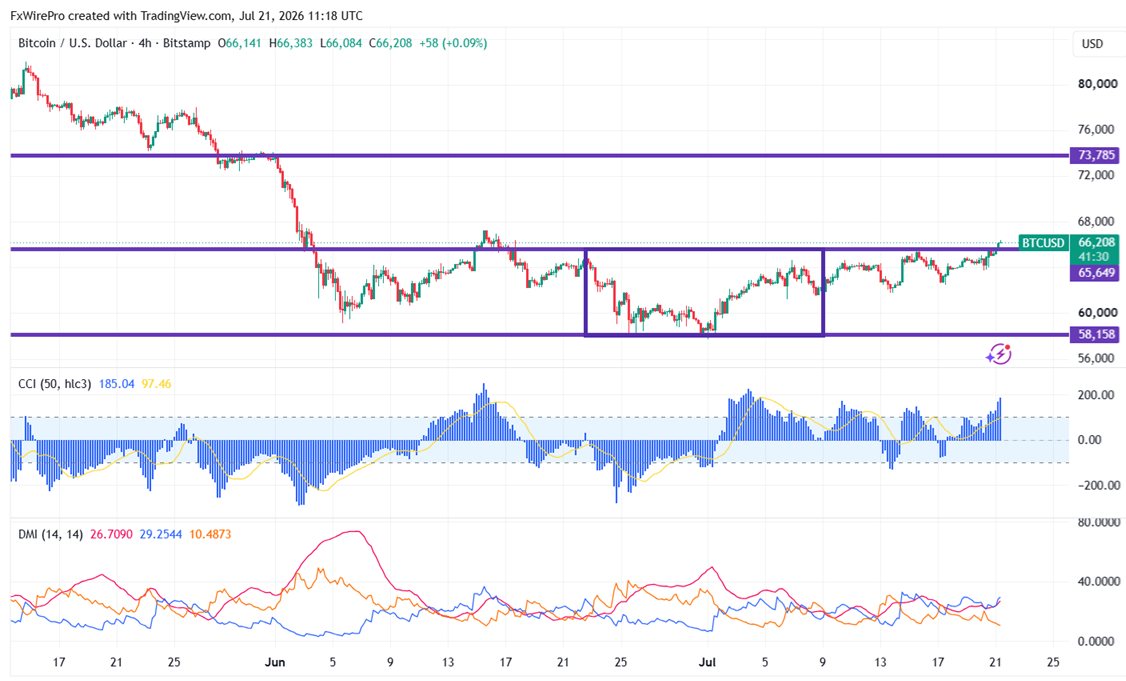
BTCUSD holds above the 365-4H EMA after a long consolidation. It hit an intraday high of $66383 and is currently trading around $66201.
|
Technicals |
CMP -$66201 |
Trend |
|
|
4- Hour chart |
Value |
|
|
|
55 EMA |
$64238 |
CMP>55 EMA |
Bullish |
|
200- EMA |
$63951 |
CMP >200- EMA |
Bullish |
|
365- EMA |
$65648 |
CMP>365 EMA |
Bullish |
|
800-EMA |
$70106 |
CMP>Vaue |
Bearish |
Major support- $57700/$52796. The pair is facing strong resistance around $67000. Any break targets $70000/$72200/474950.
|
Momentum indicator (1-hour chart) |
Inference |
Value |
|
CCI(50) |
Bullish |
167.37 |
|
ADX |
Bullish |
Strength increased from 22.03 to 25.70 |
It is good to buy on dips around $65548-550with an SL around $62450 for a TP of $74900.







