


 FxWirePro: GBP/AUD gains some upside momentum but still bearish
  FxWirePro: GBP/NZD up trend gains some momentum but hurdles ahead
  FxWirePro: USD/JPY holding bid into weekend
  FxWirePro- Major Pair levels and bias summary
  FxWirePro- Major European Indices
  FxWirePro: NZD/USD softens on Iran peace talk failure
  ETH/USD Outlook: Ethereum Targets 2,770 USD as Support Holds Near 2,150 USD
  FxWirePro: USD/CNY neutral in the near-term, scope for downward resumption
  FxWirePro: GBP/USD biased higher but rally currently stretched
  FxWirePro: EUR/AUD under pressure as key support gives way
  FxWirePro:NZD/USD uptrend loses momentum but bullish setup remains
  Energy Surge Ignites US Inflation: USDCHF Eyes Support Amid Dollar Sell-Off
  AUD/JPY Outlook: Bullish Trend Intact Despite US-Iran Diplomatic Stalls
  FxWirePro: GBP/AUD positions for another drop, eyes 1.8900level
  NZD/JPY Eyeing 95.00: Bullish Trend Holds Amid Strategic Consolidation
  NZDJPY Bulls Charge Toward 95.00: Safe-Haven Exodus Drives Kiwi Rally


Candlestick patterns never mislead us in wrong trading directions. So here’s the deal, making us well equipped with the proficiency in few key candlestick patterns would improve the ability to time the market, recognize the trading opportunities and enter at better levels.
We come up with some live instances where such leading indicators were figured out and observe their desired results.
NZDJPY’s bullish engulfing: Sharp rallies above DMAs were observed especially after bullish engulfing pattern on this pair as well (refer daily plotting). This is deemed as a reversal pattern that could either be bearish or bullish subject to whether it occurs at the end of an uptrend (bearish engulfing pattern) or a downtrend (bullish engulfing pattern). The first day is characterized by a small body (refer the previous candle of circular area at the bottom of daily chart), followed by a day whose body completely engulfs the previous day's body and closes in the opposite direction of the trend.
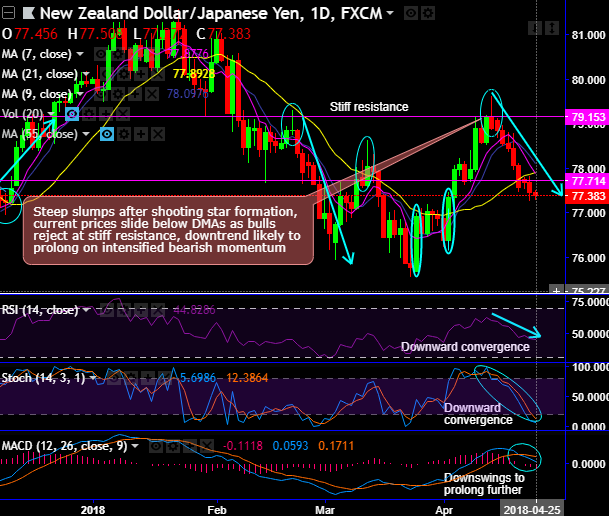
But for now, contrary to the above pattern failure swings at the stiff resistance have formed the sharp-shooting star pattern, you could make out steep slumps since then. While both leading indicators signal intensified bearish momentum.
NZDUSD’s: As you could refer daily plotting of NZDUSD, upon doji and shooting star patterns, the bears resume again in the minor trend especially after the failure swings at the channel resistance and tumbled towards channel supports. More details on the same are available in the below weblink:
USDJPY’s bullish engulfing: We spotted out USDJPY’s bullish engulfing candlestick patterns at 105.396, 106.842 and 106.600 levels in the recent past. Ever since then, the stern rallies have taken the current prices well above DMAs. The call has been advised on the bullish pattern candlesticks when USDJPY spot FX was trading at 106.950 levels, for more reading on the same, refer the below weblink posted on 12th April:
Well, you’ve seen the bullish effects of this pair as the USD staged a strong recovery in the second half of last week, which has taken prices back to important resistance levels within the medium-term range. This comes as US equities have slipped back to the middle of their current trading range (a plethora of key tech stock Q1 earnings reports are due this week) and US yields have extended recent gains, with 10-year yields now close to the psychological 3% level.
FxWirePro launches Absolute Return Managed Program. For more details, visit:


