


 FxWirePro: USD/CAD runs out of steam but maintains bullish outlook
  FxWirePro- Major Crypto levels and bias summary
  Euro Bulls Charge Past 1.1600: Broad Dollar Sell-Off Ignites Powerful EURUSD Rally
  Bitcoin Recovers Amid Easing Geopolitics: Bulls Target USD 80,000 Support Rebound
  FxWirePro- Major Pair levels and bias summary
  Bitcoin on Edge: Geopolitical Tensions Weigh on BTC as Bulls Eye the USD 64,000 "Buy the Dip" Zone
  AUDJPY Pullback Intensifies: Resistance at 110.00 Signals Short Opportunity
  FxWirePro: USD/ZAR fibo rejection triggers sizeable pullback
  Bitcoin’s High-Stakes Volatility: BTCUSD Navigates Geopolitical Storms
  Ethereum Trails Bitcoin’s Retreat: Key Support Levels in Focus
  EUR/JPY Bulls Charge: Eyeing 186.00 as Euro Strength Intensifies
  FxWirePro- Major European Indices


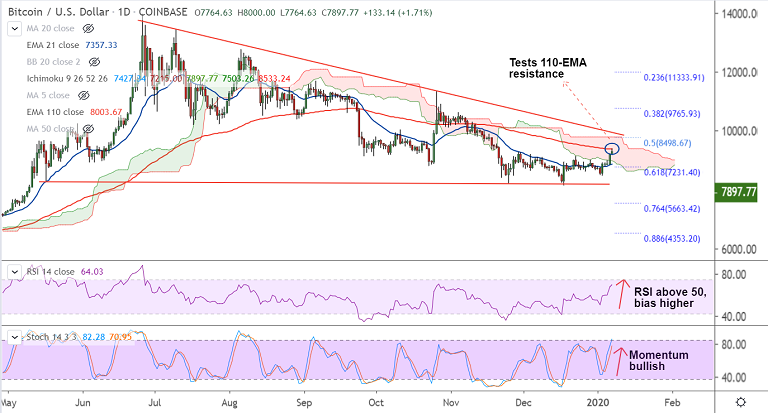
BTC/USD chart - Trading View
Exchange - Coinbase
Support: 7564 (55-EMA); Resistance: 8003 (110-EMA)
Technical Analysis: Bias Bullish
BTC/USD briefly tested the $8000 mark before paring some gains to slip back to 7891 at around 04:15 GMT.
The pair broke the 55-EMA barrier to close 5.56% higher on Monday's trade. price currently capped below 110-EMA resistance at 8003.
Near-term trend has shifted to bullish with short-term MAs crossing over the longer-term MAs on the GMMA indicator.
The renewed interest in the asset is mainly connected to the upcoming May 2020 halving event.
The prevailing trend is strongly bullish as shown by the upward moving RSI which holds well above 60 mark.
Stochs are bias higher and rising volatility raises scope for continued bullish momentum.
Breakout at 110-EMA (8003) eyes 21W EMA at 8140 ahead of cloud top at 8533.


