


 FxWirePro: GBP/USD recovers but bears are not done yet again
  Ethereum Retreats Toward USD 2,000: Technicals Signal Caution as ETH Mimics Bitcoin’s Pullback
  Aussie Retreats Against the Yen: AUDJPY Bears Target 108 as 110 Resistance Holds Firm
  FxWirePro: AUD/USD downside pressure builds, key support level in focus
  FxWirePro: GBP/NZD range to extend until there is game changing news
  FxWirePro: USD/ZAR sustains gains as uptrend remains strong
  FxWirePro- Major Crypto levels and bias summary
  FxWirePro- Woodies Pivot(Major)
  Bitcoin on Edge: Geopolitical Tensions Weigh on BTC as Bulls Eye the USD 64,000 "Buy the Dip" Zone
  FxWirePro- Major Crypto levels and bias summary
  FxWirePro: USD/CAD runs out of steam but maintains bullish outlook


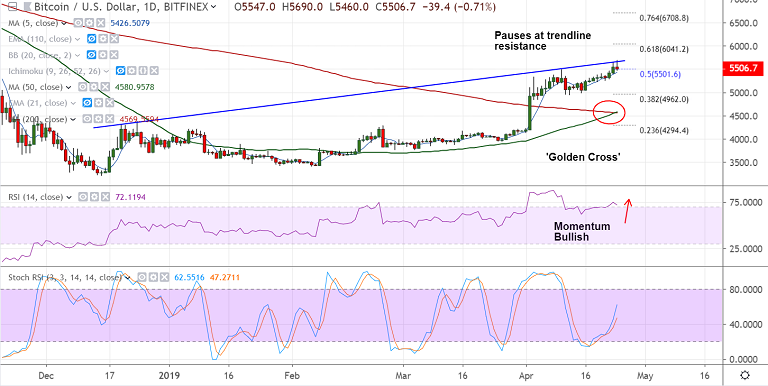
BTC/USD chart - Trading View
Exchange - Bitfinex
Support: 5425 (5-DMA); Resistance: 5650 (trendline)
Technical Analysis: Bias Bullish
- BTC/USD edges lower from new 2019 highs at 5690
- Upside is struggling stiff trendline resistance at 5650, breakout required for further upside
- Retrace from highs has found support at 1H 55-EMA. Pair is extending sideways from past few hours
- Momentum with the bulls, confirmed 'Golden Cross' on daily charts keeps scope for upside
- Price action is above major moving averages and daily cloud and is holding above 5-DMA
- Volatility is rising as evidenced by widening Bollinger bands and we see +ve DMI dominance
- Break above trendline resistance opens upside, scope for test of 61.8% Fib at 6041
- Break below 5-DMA will see dip till 21-EMA. Bullish invalidation below 200-DMA
For details on FxWirePro's Currency Strength Index, visit http://www.fxwirepro.com/currencyindex.

- News

- Economy

- Central Banks
- Investing
- Research
- Roundups
- Digital Currency
- Insights
- Technical Analysis
- Technology
- Business
- Law
- Health
- Nature
- Fintech
- Science
- Topic
- Opinions
- ©Econometrics LLC . All Rights Reserved.
Crypto Technicals: BTC/USD holds above 5-DMA, potential 'Golden Cross' keeps scope for upside
Wednesday, April 24, 2019 10:06 AM UTC
Editor's Picks


- Market Data
Most Popular


9


