


 FxWirePro- Major Pair levels and bias summary
  Ethereum Joins the Rally: ETH Reclaims USD 2,100 Following Bitcoin's Lead
  FxWirePro: USD/JPY edges up as yen dips after soft household spending data
  FxWirePro: USD/ZAR continues to recovers , upside pressure builds
  EUR/JPY Breaks Out: Euro Surges Past 185.00 Resistance Amid Strong Bullish Momentum
  NZDJPY Bearish Breakdown: Why Selling the Rallies is the Strategic Play
  Aussie Ascent: AUDJPY Charges Toward 112 as Bullish Momentum Hits Five-Day High
  FxWirePro: EUR/AUD eases as market awaits Iran deadline
  NZD/JPY Rockets as Kiwi Dollar Resilience Defies the Oil Shock
  Ethereum Rises on Geopolitical De-escalation: Pezeshkian’s Peace Signal Ignites Bullish Momentum
  FxWirePro- Major Crypto levels and bias summary
  FxWirePro- Major Crypto levels and bias summary


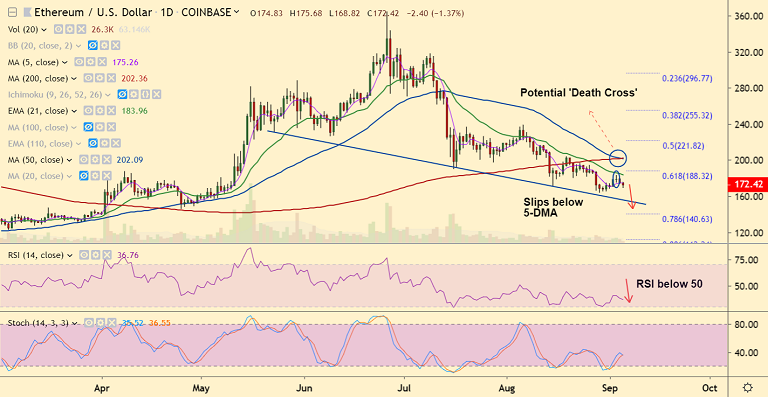
ETH/USD chart - Trading View
Exchange - Coinbase
Support: 155.85 (Trendline); Resistance: 175.23 (5-DMA)
Technical Analysis: Bias Bearish
ETH/USD trades 1.51% lower on the day at 172.12 at 10:50 GMT, bias is bearish.
The pair is extending weakness after rejection at 21-EMA, slips below 5-DMA support.
Technical indicator on the intraday charts are bearishly aligned. RSI well below 50 which supports downtrend.
Volatility is rising and a potential 'Death Cross' (bearish 50-DMA crossover on 200-DMA) adds downside pressure.
Next bear target lies at 155.85 (trendline support) ahead of Apr 25th low at 146.
5-DMA is immediate resistance at 175.23. Breakout above 21-EMA (183.95) will negate near-term bearish bias.


