


 FxWirePro:NZD/USD remains vulnerable as Trump's latest deadline leaves investors on edge
  FxWirePro: EUR/AUD gaining momentum for a move towards 1.6800 level
  FxWirePro: GBP/NZD remains buoyant, looks to extend gains
  Aussie Retreats Against the Yen: AUDJPY Bears Target 108 as 110 Resistance Holds Firm
  FxWirePro: USD/JPY holds range near 160 as intervention risks loom
  Aussie Ascent: AUDJPY Reclaims 110.00 as Bullish Momentum Ignites
  Ethereum Retreats Toward USD 2,000: Technicals Signal Caution as ETH Mimics Bitcoin’s Pullback
  FxWirePro:NZD/USD drifts lower, could be on verge of bigger drop
  FxWirePro: USD/JPY firms as Trump's address on Gulf war spark fresh concerns
  Kiwi Under Pressure: NZDJPY Signals Bearish Turn as Resistance at 92.00 Holds Firm


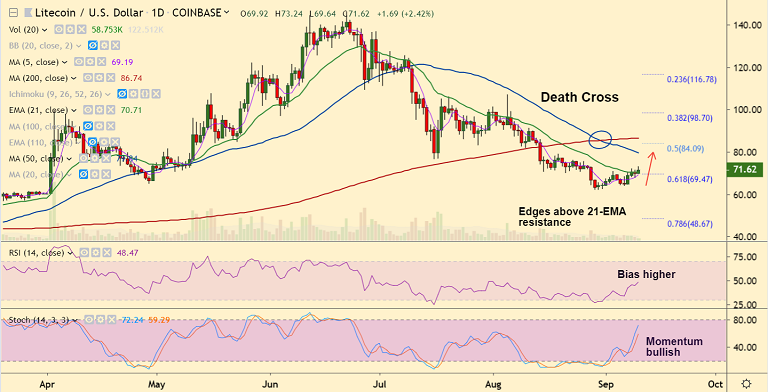
LTC/USD chart - Trading View
Exchange - Coinbase
Support: 69.28 (5-DMA); Resistance: 73.80 (4H 200 SMA)
Technical Analysis: Intraday bias bullish
Litecoin is trading 2.95% higher on the day at 71.98 at 04:00 GMT, intraday bias is bullish.
Stochs and RSI are biased higher and 'bullish divergence' on Stochs adds to the bullish bias.
LTC/USD has edged above 200H SMA and is trading above cloud and major EMAs on the hourly chart.
Major trend is bearish, however, the pair has edged above 21-EMA raising scope for upside.
4H 200 SMA is strong resistance at 73.80, breakout above will confirm further gains.
Break above 4H 200 SMA (73.80) eyes 50-DMA at 79.84 ahead of 200-DMA at 86.74.
'Death Cross' could limit gains. 200-DMA breakout negates bearish bias.


