


 FxWirePro: NZD/USD cautiously bid as traders sense end to Iran war
  FxWirePro- Major Crypto levels and bias summary
  FxWirePro: AUD/USD downside pressure builds, key support level in focus
  FxWirePro- Woodies Pivot(Major)
  Ethereum Trails Bitcoin’s Retreat: Key Support Levels in Focus
  Ethereum Rises on Geopolitical De-escalation: Pezeshkian’s Peace Signal Ignites Bullish Momentum
  Bitcoin on Edge: Geopolitical Tensions Weigh on BTC as Bulls Eye the USD 64,000 "Buy the Dip" Zone
  AUDJPY Pullback Intensifies: Resistance at 110.00 Signals Short Opportunity
  Bitcoin’s High-Stakes Volatility: BTCUSD Navigates Geopolitical Storms
  Yen Resurgence Drives GBPJPY to 2.5-Week Low: Sellers Aim for 208.00
  FxWirePro: GBP/NZD range to extend until there is game changing news
  FxWirePro: USD/CAD runs out of steam but maintains bullish outlook


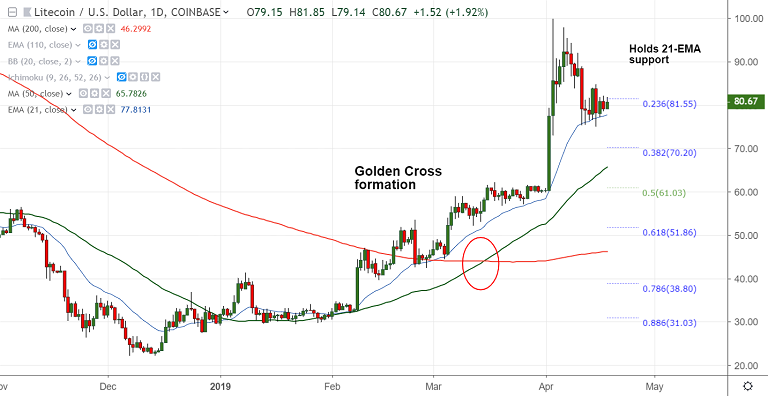
LTC/USD chart - Trading View
Exchange - Coinbase
Support: 77.80 (21-EMA); Resistance: 86.54 (weekly cloud)
Technical Analysis: Bias Neutral
- Litecoin upside has been capped at weekly cloud. Overall market sentiment is still holding bullish
- LTC/USD is holding support at 21-EMA, break below could change the near-term equation
- RSI is above 50 levels, but Stochs are sharply lower. Technical indicators are conflicting
- Nevertheless, 'Golden Cross ' formed on the daily charts keeps scope for gains
- Break below 21-EMA will see dip till 70.20 (38.2% Fib) and then 65.78 (50-DMA)
- On the flipside, bounce off 21-EMA and close above 5-DMA accompanied by turn in Stochs and RSI will see resumption of upside
- Scope then for test of 99 levels. Break above weekly cloud base to propel the pair higher
For details on FxWirePro's Currency Strength Index, visit http://www.fxwirepro.com/currencyindex.

- News

- Economy

- Central Banks
- Investing
- Research
- Roundups
- Digital Currency
- Insights
- Technical Analysis
- Technology
- Business
- Law
- Health
- Nature
- Fintech
- Science
- Topic
- Opinions
- ©Econometrics LLC . All Rights Reserved.
Crypto Technicals: LTC/USD holds 21-EMA support, break below to see dip till 70.20
Thursday, April 18, 2019 10:33 AM UTC
Editor's Picks


- Market Data
Most Popular


