


 FxWirePro: GBP/NZD range to extend until there is game changing news
  FxWirePro: USD/JPY firms as Trump's address on Gulf war spark fresh concerns
  FxWirePro: USD/CNY gains some ground but bearish outlook persists
  FxWirePro:NZD/USD remains vulnerable as Trump's latest deadline leaves investors on edge
  FxWirePro- Major Crypto levels and bias summary
  Bitcoin Recovers Amid Easing Geopolitics: Bulls Target USD 80,000 Support Rebound
  FxWirePro: EUR/AUD gaining momentum for a move towards 1.6800 level
  Aussie Retreats Against the Yen: AUDJPY Bears Target 108 as 110 Resistance Holds Firm
  FxWirePro- Major European Indices


 fails at 20-DMA, squashes hope for recovery - EconoTimes)


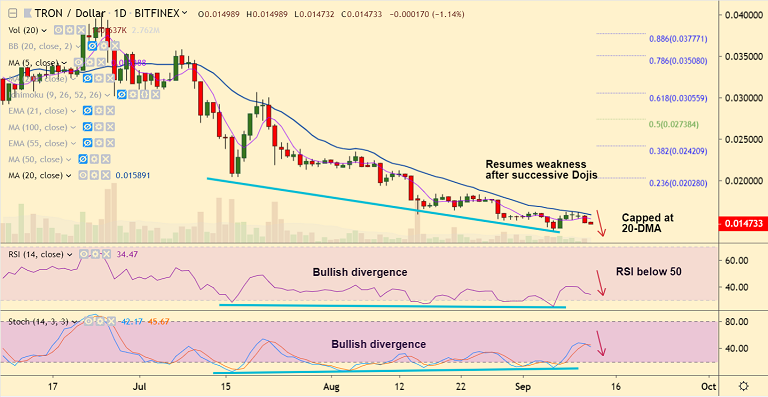
TRX/USD chart - Trading View
Exchange - Bitfinex
Support: 0.013951 (Lower BB); Resistance: 0.015891 (20-DMA)
Technical Analysis: Bias Bearish
TRON (TRX) resumes weakness after rejection at 20-DMA resistance.
TRX/USD was trading at 0.014733 at 02:25 GMT, down 1.14% at the time of writing.
Successive 'Doji' formation seen at 20-DMA resistance. The pair has slipped below 5-DMA.
Major trend has been bearish and minor recovery hopes squashed after failure at 20-DMA.
Stochs and RSI are now biased lower and Stochastics RSI is showing rollover from overbought levels.
Scope for dip till lower Bollinger band at 0.013951 and further weakness may see test of 0.0111 (2018 lows).
'Bullish divergence' on RSI and Stochastics seen. However, upside only on break above 21-EMA.


