


 FxWirePro- Major Pair levels and bias summary
  FxWirePro- Major Pair levels and bias summary
  FxWirePro: AUD/USD downside pressure builds, key support level in focus
  FxWirePro: USD/CAD runs out of steam but maintains bullish outlook
  Euro Retreats as Geopolitical Tensions Surge: EURUSD Eyes 1.1400 Floor Amid Safe-Haven Demand
  Euro Bulls Charge Past 1.1600: Broad Dollar Sell-Off Ignites Powerful EURUSD Rally
  FxWirePro- Major Crypto levels and bias summary
  FxWirePro- Major Crypto levels and bias summary
  FxWirePro- Woodies Pivot(Major)
  FxWirePro: GBP/USD recovers but bears are not done yet again
  Ethereum Rises on Geopolitical De-escalation: Pezeshkian’s Peace Signal Ignites Bullish Momentum
  FxWirePro: EUR/AUD gaining momentum for a move towards 1.6800 level


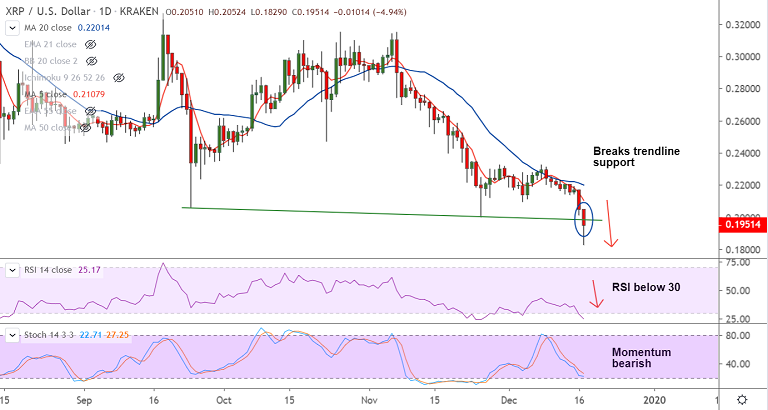
XRP/USD chart - Trading View
Exchange - Kraken
Support: 0.1800 (Nov 2017 low); Resistance: 0.2105 (5-DMA)
Technical Analysis: Bias Bearish
Ripple (XRP) extends previous session's slump, hits lows unseen since Nov 2017, bias strongly bearish.
XRP/USD was trading 0.1949 at around 09:00 GMT, slightly higher from session lows at 0.1829.
The pair is set to extend weakness with technical indicators strongly supporting downside.
That said, oscillators are at oversold levels and price action has edged outside the lower Bollinger band.
Minor consolidation, if not upticks possible before the next leg lower. Near-term upside only above 21-EMA (currently at 0.2218).
Little support seen on the downside. Next major bear targets lie at 0.1800 (Nov 2017 low) ahead at 0.1500 (Sept 2017 low).


