


 FxWirePro: USD/CAD runs out of steam but maintains bullish outlook
  FxWirePro: USD/CNY dips as China’s yuan strengthens on Iran war de escalation hopes
  FxWirePro: EUR/ NZD loses momentum but outlook is bullish
  FxWirePro- Major Crypto levels and bias summary
  FxWirePro: USD/JPY neutral in the near-term, scope for downward resumption
  FxWirePro: EUR/AUD retreats slightly but trend is still bullish
  FxWirePro: GBP/USD recovers but bears are not done yet again
  NZDJPY Technical Outlook: Bearish Bias Deepens as Key Resistances Hold
  Bitcoin’s High-Stakes Volatility: BTCUSD Navigates Geopolitical Storms
  Bitcoin on Edge: Geopolitical Tensions Weigh on BTC as Bulls Eye the USD 64,000 "Buy the Dip" Zone
  FxWirePro- Major Crypto levels and bias summary


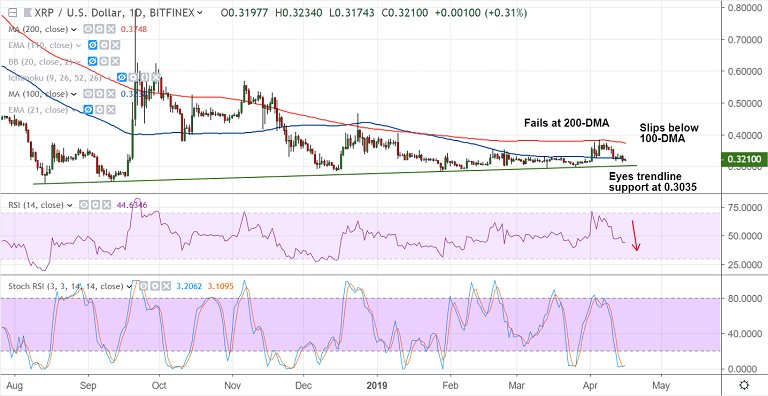
XRP/USD chart - Trading View
Exchange - Bifinex
Support: 0.3040 (trendline); Resistance: 0.3238 (100-DMA)
Technical Analysis: Bias Bearish
- XRP/USD fails at 200-DMA, slips below 100-DMA
- Price has fallen below major EMAs on the daily chart
- Stochs and RSI are sharply lower and RSI is below 50 mark
- Recovery lacks traction, upside capped at 100-DMA
- Scope for test of strong trendline support at 0.3035
For details on FxWirePro's Currency Strength Index, visit http://www.fxwirepro.com/currencyindex.

- News

- Economy

- Central Banks
- Investing
- Research
- Roundups
- Digital Currency
- Insights
- Technical Analysis
- Technology
- Business
- Law
- Health
- Nature
- Fintech
- Science
- Topic
- Opinions
- ©Econometrics LLC . All Rights Reserved.
Crypto Technicals: XRP/USD capped below 100-DMA, dip till 0.3040 likely
Tuesday, April 16, 2019 1:32 PM UTC
Editor's Picks


- Market Data
Most Popular


