


 FxWirePro- Major Crypto levels and bias summary
  FxWirePro- Major Crypto levels and bias summary
  Sterling Slide: GBPJPY Breaks Critical Support as Bears Take Control
  FxWirePro: USD/JPY slips as Japan intervention risk boosts Yen
  Ethereum Reclaims $2,000 Handle: ETHUSD Stabilizes as Bulls Eye a Recovery
  Aussie Losing Its Luster: AUDJPY Breaks Below 110.00 as Bearish Momentum Intensifies
  Bitcoin’s High-Stakes Volatility: BTCUSD Navigates Geopolitical Storms
  FxWirePro: GBP/USD slips to four-month low with plenty more downside potential
  Bitcoin on Edge: Geopolitical Tensions Weigh on BTC as Bulls Eye the USD 64,000 "Buy the Dip" Zone
  FxWirePro- Major Pair levels and bias summary
  FxWirePro: EUR/AUD eases slightly but trend is still bullish
  Kiwi Retreat: Yen Momentum Targets 90.00 Support


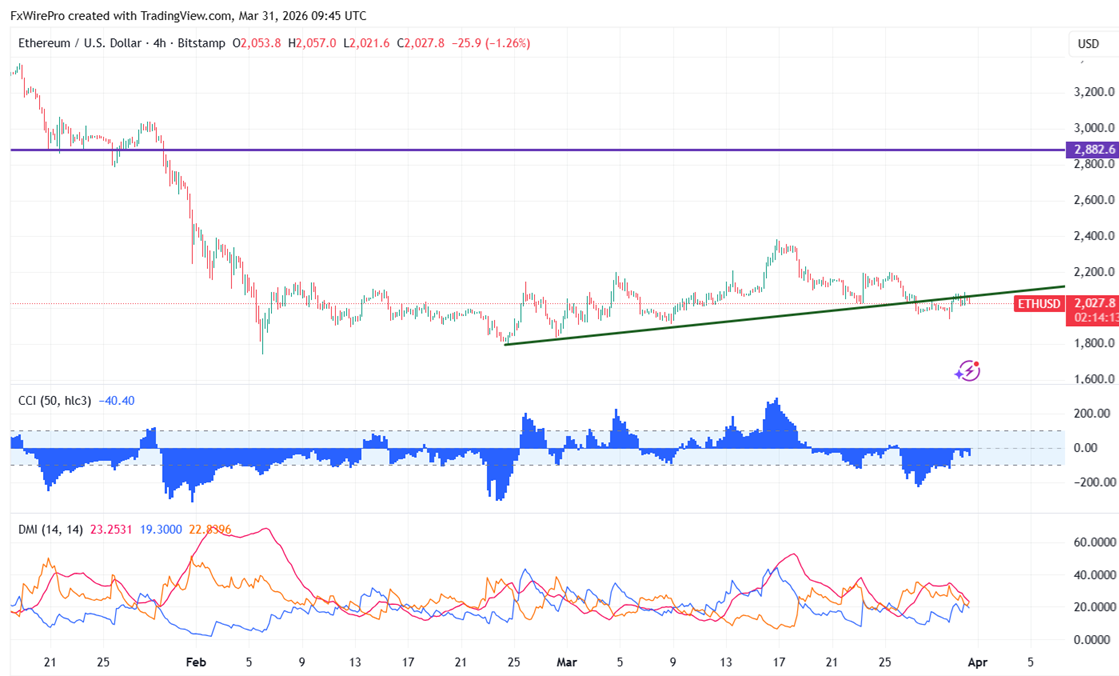
Ethereum has traded in a narrow range between $2199 and $1937 for the past five days. After hitting a peak around $2199, it’s currently hovering near $2029.
|
Technicals |
CMP -$2029 |
Trend |
|
|
4- Hour chart |
Value |
|
|
|
55 EMA |
$2065 |
CMP < 55 EMA |
Bearish |
|
200- EMA |
$2105 |
CMP < 200- EMA |
Bearish |
|
365- EMA |
$2217 |
CMP < 365 EMA |
Bearish |
Major support- $1700/$1500. Minor bullishness only above $2200. Any violation above targets $2386/$2500/$2700/$2880/$3000.
|
Momentum indicator (4-hour chart) |
Inference |
Value |
|
CCI(50) |
Bearish |
-18.72 |
|
ADX |
Neutral |
|
It is good to buy on dips around $2000 with SL around $1700 for a TP of $2770.


