


 FxWirePro: Daily Commodity Tracker - 21st March, 2022
  Gold Prices Fall Amid Rate Jitters; Copper Steady as China Stimulus Eyed


Last night US Federal Reserve delivered it's much anticipated rate hike of 25 basis points, which market took rather well. Market participants have come to the terms that one single hike, though signaling end of loose monetary policy is less important than actual hike path.
In our previous series named FED liftoff available http://www.econotimes.com/FED-liftoff-series-%E2%80%93-end-of-series-note-132189#e , we discussed historically path of hike has been more vital for assets, namely equities. At a time of slower hike, equities returned 11% on an average, while declined by 3% on an average in time of faster pace.
Regarding the hike path, however there exists considerable confusion.
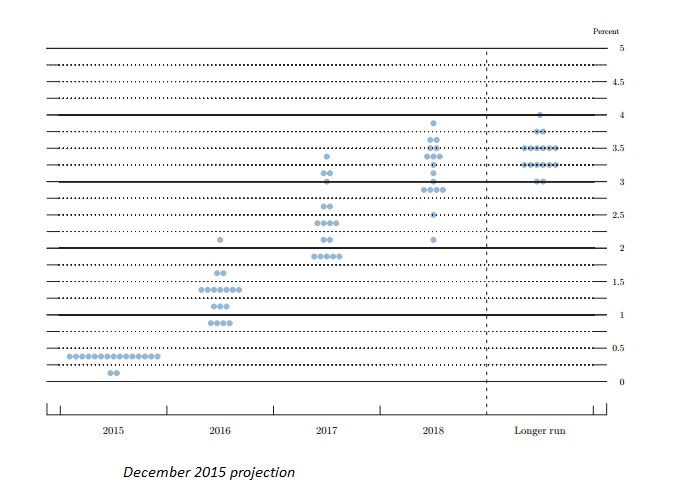
Market as of now, is pricing 2 hikes in 2016, 25 basis points each, while FED participants are projecting four rate hikes of 25 basis points each. FED dotplot is showing average interest rate expectations stand at 1.375% in 2016 from current 0.375%. FED projection from September hasn't changed.
Economists have projected (both Reuters and Financial Times) 75 basis points hike in 2016.
We expect the pact would might vary between one or two, depending on the reinvestment decision.
Why market shrugged off hawkish dot-plot then?
FED dot-plot hasn't been a great guide, especially in terms of certainty. We go back a year ago, December 2014 meeting.
Materials from that meeting suggest FED participants were projecting four rate hike of 25 basis points each but in reality FED has actually delivered one. No wonder, market is taking it lightly.
However, we expect this considerable gap of 50 basis points will close eventually but from which side would broadly influence Dollar.


