


 Indonesia Surprises Markets with Interest Rate Cut Amid Currency Pressure
  FxWirePro: GBP/NZD range to extend until there is game changing news
  FxWirePro- Major Pair levels and bias summary
  FxWirePro: AUD/USD downside pressure builds, key support level in focus
  US Futures Rise as Investors Eye Earnings, Inflation Data, and Wildfire Impacts
  FxWirePro: USD/JPY firms as Trump's address on Gulf war spark fresh concerns
  NZDJPY Bears Take Control: New Zealand Dollar Retreats as 92 Resistance Holds Firm
  FxWirePro- Major Pair levels and bias summary
  FxWirePro: EUR/ NZD steadies around 2.0150, retains bid tone
  U.S. Banks Report Strong Q4 Profits Amid Investment Banking Surge
  Ethereum Retreats Toward USD 2,000: Technicals Signal Caution as ETH Mimics Bitcoin’s Pullback
  Moody's Upgrades Argentina's Credit Rating Amid Economic Reforms
  FxWirePro: USD/CNY gains some ground but bearish outlook persists
  FxWirePro- Major European Indices
  FxWirePro: GBP/USD outlook weaker on renewed downside pressure
  China’s Growth Faces Structural Challenges Amid Doubts Over Data
  Oil Prices Dip Slightly Amid Focus on Russian Sanctions and U.S. Inflation Data


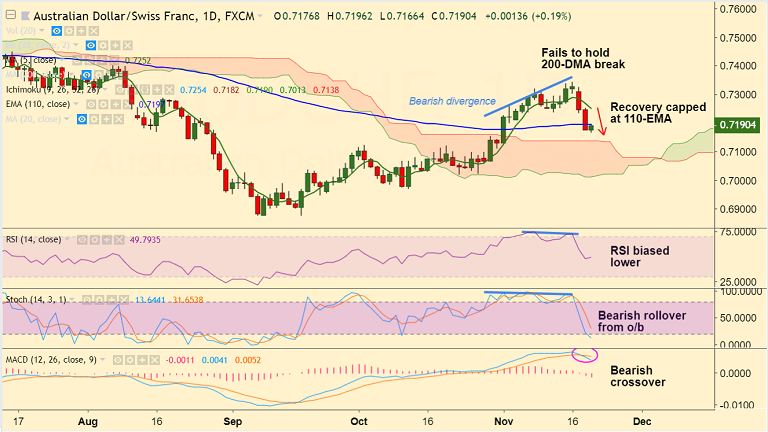
AUD/CHF chart on Trading View used for analysis
- AUD/CHF has resumed downside after brief pause on Wednesday's trade.
- Price is extending weakness after failure to hold break above 200-DMA, slips lower with a spinning top formation.
- Technical indicators on daily charts are bearish. Stochs and RSI have rolled are biased lower.
- We see bearish divergence on RSI and Stochs which adds to the bearish bias.
- 5-DMA is sharply lower and MACD is showing a bearish crossover on signal line.
- The pair is currently holding strong support at 110-EMA, break below to see major weakness.
- Next major support below 110-EMA lies at 21-EMA at 0.7212 ahead of 0.7136 (converged trendline and cloud top)
Support levels - 0.7198 (110-EMA), 0.7212 (21-EMA), 0.7136 (cloud top and trendline), 0.71
Resistance levels - 0.7213 (5-DMA), 0.7292 (200-DMA), 0.73
For details on FxWirePro's Currency Strength Index, visit http://www.fxwirepro.com/currencyindex.


