


 Trump’s "Shock and Awe" Agenda: Executive Orders from Day One
  FxWirePro: EUR/AUD eases as market awaits Iran deadline
  China's Refining Industry Faces Major Shakeup Amid Challenges
  Aussie Bulls Charge: AUD/JPY Rallies as Geopolitical Clouds Part
  FxWirePro- Major European Indices
  FxWirePro: GBP/AUD downtrend extends, eyes 1.8900 evel
  FxWirePro: GBP/NZD edges up, remains on front foot
  FxWirePro- Major Pair levels and bias summary
  FxWirePro: USD/JPY edges up as yen dips after soft household spending data
  European Stocks Rally on Chinese Growth and Mining Merger Speculation
  Wall Street Analysts Weigh in on Latest NFP Data
  EUR/JPY Breaks Out: Euro Surges Past 185.00 Resistance Amid Strong Bullish Momentum
  Goldman Predicts 50% Odds of 10% U.S. Tariff on Copper by Q1 Close
  S&P 500 Relies on Tech for Growth in Q4 2024, Says Barclays
  FxWirePro: USD/CNY drifts lower, vulnerable to more downside
  Aussie Ascent: AUDJPY Charges Toward 112 as Bullish Momentum Hits Five-Day High


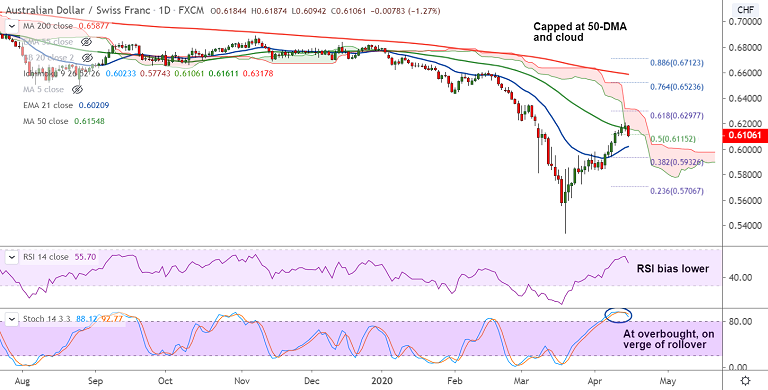
AUD/CHF chart - Trading View
AUD/CHF was trading 1.22% lower on the day at 0.6110 at around 11:25 GMT after 'Spinning Top' formation on the previous day's candle.
After gaining over 16% from 2020 lows at 0.5341, the pair is showing signs of minor correction.
Stiff resistance is seen at 50-DMA and daily cloud. Technical studies show oscillators are at overbought levels.
GMMA shows shift in major and minor trend on the hourly charts. Daily charts show neutral trend.
RSI has turned and Stochastics are on verge of rollover from overbought levels.
The pair finds strong support at 200H MA at 0.6050. Break below will confirm further weakness.
Next immediate support lies at 21-EMA at 0.6021 ahead of 38.2% Fib at 0.5932 and 20-DMA at 0.5929.
On the flipside, decisive break above 55-EMA required for upside continuation.


