


 FxWirePro: USD/CNY neutral in the near-term, scope for downward resumption
  FxWirePro- Major Pair levels and bias summary
  FxWirePro: GBP/AUD positions for another drop, eyes 1.8900level
  FxWirePro: USD/CAD extends decline on broad dollar weakness
  FxWirePro- Major Crypto levels and bias summary
  FxWirePro: GBP/USD biased higher but rally currently stretched
  FxWirePro: USD/CAD recovers slightly but bearish outlook persists
  Bitcoin’s Volatile Reset: ETFs Rebound as Bulls Eye USD 80,000 Milestone
  FxWirePro: AUD/USD retreats slightly but trend is still bullish
  FxWirePro -Major European Indices
  FxWirePro- Woodies Pivot(Major)
  Energy Surge Ignites US Inflation: USDCHF Eyes Support Amid Dollar Sell-Off
  FxWirePro: GBP/USD bulls remain cautiously optimistic
  FxWirePro: EUR/CAD gains ground on prospects of resumed energy flows
  FxWirePro: USD/JPY holding bid into weekend
  FxWirePro- Major Pair levels and bias summary


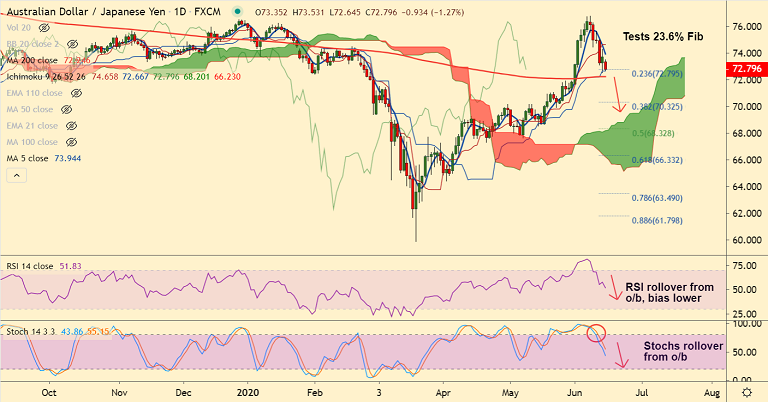
AUD/JPY chart - Trading View
AUD/JPY was trading 0.87% lower on the day at 73.09 at around 09:00 GMT, after closing 0.65% higher in the previous session.
The pair is extending pullback from 12-month highs at 76.788 hit on June 8th and indicators show scope for further weakness.
Stochs and RSI have rolled back from overbought levels and are sharply lower. MACD has made a bearish crossover on signal line.
Price action is above cloud, but Chikou Span has turned bearish, suggesting downside.
Bears have tested 23.6% Fib and are holding support at Kijun Sen at 72.66. Break below will see next major support at 200-DMA.
Violation at 200-DMA will see major weakness. Dip till 50% Fib retracement at 68.32 then likely.
Support levels - 72.66 (Kijun Sen), 72.24 (200-DMA), 71.24 (55-EMA)
Resistance levels - 74.01 (5-DMA), 74.65 (Tenkan Sen), 75.70 (110W EMA)


