


 FxWirePro:NZD/USD uptrend loses momentum but bullish setup remains
  FxWirePro: USD/JPY holding bid into weekend
  FxWirePro- Major Pair levels and bias summary
  Ethereum’s Healthy Correction: Bulls Eye Strategic Re-Entry at 2,150 USD Following Profit-Booking Pullback
  Bitcoin’s Islamabad Watch: BTCUSD Consolidates Near 71,421 USD as Geopolitical Peace Talks Loom
  FxWirePro -Major European Indices
  FxWirePro: EUR/CAD gains ground on prospects of resumed energy flows
  FxWirePro: EUR/AUD under pressure as key support gives way
  Bitcoin’s Volatile Reset: ETFs Rebound as Bulls Eye USD 80,000 Milestone
  FxWirePro- Major Crypto levels and bias summary
  FxWirePro: GBP/NZD down trend loses steam, remains on bearish path
  FxWirePro- Woodies Pivot(Major)
  FxWirePro: AUD/USD retreats slightly but trend is still bullish
  FxWirePro: GBP/USD biased higher but rally currently stretched
  FxWirePro- Major Pair levels and bias summary
  FxWirePro: USD/ZAR recovers slightly but trend is still bearish
  FxWirePro: USD/ZAR edges lower ,investors remain on edge


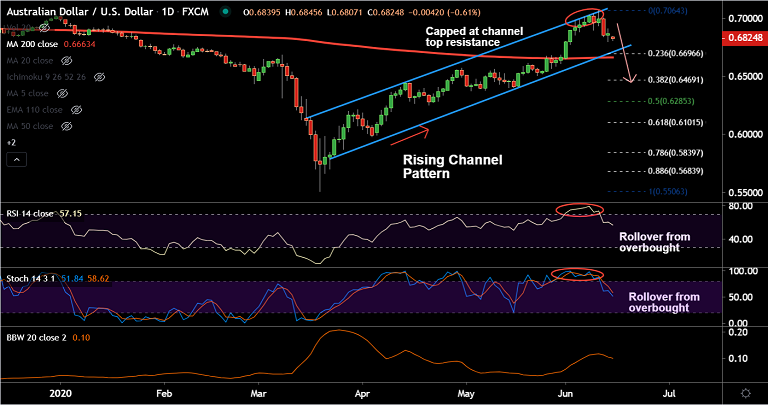
AUD/USD chart - Trading View
Technical Analysis: Bias Bearish
GMMA Indicator
- Major and minor trend are strongly bearish on the hourly charts
- Daily chart shows major trend is still bullish, while minor trend is bearish
Ichimoku Analysis
- Price action is well above the daily cloud, but has slipped below on the hourly charts
- The Chikou Span on the daily charts has turned South suggesting near-term trend reversal
Oscillators
- Oscillators are in neutral zone and biased lower
- Stochs and RSI have rolled over from overbought levels with further downside scope
Bollinger Bands
- Bollinger bands are narrowing on the daily charts
- Volatility remains high, suggesting the pair could see major price swings
Major Support: 0.6663 (200-DMA)
Major Resistance: 0.6932 (Tenkan Sen)
Summary: AUD/USD has been extending downside after rejection at channel top. Technical indicators have turned bearish and we see scope for dip till channel base at 0.6715. 200-DMA is major support at 0.6663, breach below will open downside. Focus on RBA meeting minutes (Tuesday 01:30 GMT) for direction.


