


 Ethereum Consolidates: Bullish Technicals Point to a Potential $3,000 Breakout
  FxWirePro: USD/ZAR edges lower ,investors remain on edge
  FxWirePro- Major Pair levels and bias summary
  FxWirePro: EUR/CAD gains ground on prospects of resumed energy flows
  FxWirePro: USD/ZAR recovers slightly but trend is still bearish
  FxWirePro- Major Pair levels and bias summary
  Bitcoin’s Volatile Reset: ETFs Rebound as Bulls Eye USD 80,000 Milestone
  FxWirePro- Major Crypto levels and bias summary
  FxWirePro: GBP/USD bulls remain cautiously optimistic
  FxWirePro: EUR/AUD under pressure as key support gives way
  FxWirePro: GBP/AUD gains some upside momentum but still bearish
  FxWirePro:NZD/USD uptrend loses momentum but bullish setup remains
  FxWirePro: USD/CAD recovers slightly but bearish outlook persists
  FxWirePro: GBP/NZD up trend gains some momentum but hurdles ahead
  FxWirePro: USD/CNY neutral in the near-term, scope for downward resumption


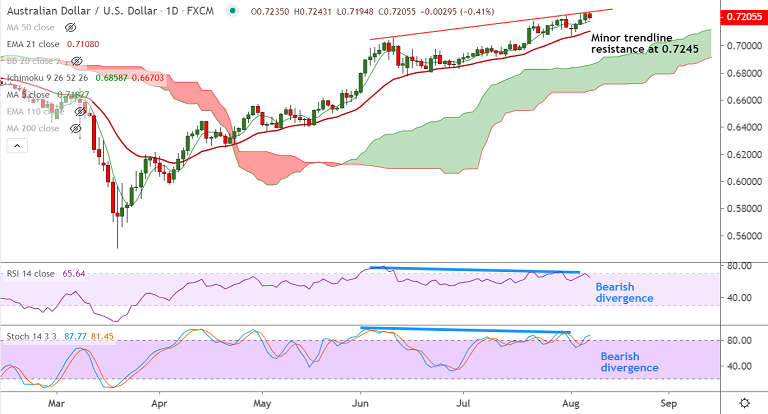
AUD/USD chart - Trading View
Technical Analysis: Bias Bullish
GMMA Indicator
- Minor and major trend are strongly bullish
- Price action is above major moving averages
Ichimoku Analysis
- The pair trades above cloud on the daily and weekly charts
- Chikou span shows some weakness on the daily charts
Oscillators
- Oscillators are at overbought levels
- Bearish divergence on the oscillators on the daily charts raises scope for some downside
Bollinger Bands
- Bollinger bands are wide on the daily and weekly charts
- Volatility to remain high
Major Support: 0.7107 (21-EMA)
Major Resistance: 0.7257 (200W MA)
Summary: Major trend in the pair is bullish. Overbought oscillator and bearish divergence can cause minor pullbacks. Focus on key U.S. NFP data for further impetus. Decisive break above 200W MA will fuel further gains.


