


AUD/USD chart - Trading View
Spot Analysis:
Intraday High/Low: 0.7661/ 0.7610
Previous Day's High/Low: 0.7660/ 0.7602
Previous Week's High/Low: 0.7664/ 0.7531
Technical Analysis: Bias Neutral
GMMA Indicator - Neutral
ADX Indicator - Neutral
Oscillators: In neutral zone
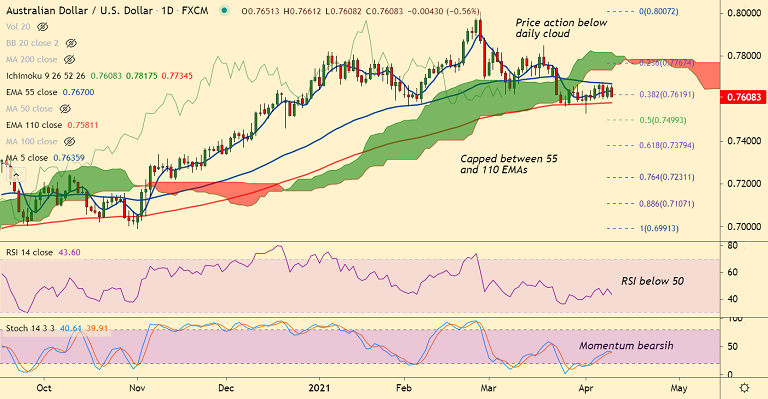
Ichimoku Cloud Analysis: Price action below cloud, Chikou span biased lower
Bollinger Bands: Volatility is high
Daily Support/Resistance Levels:
Support: 0.76, 0.7581 (110-EMA), 0.7523 (Lower BB)
Resistance: 0.7636 (5-DMA), 0.7656 (21-EMA), 0.7670 (55-EMA)
Summary: The pair trades directionless, technical indicators do not provide a clear directional bias. Price action is capped between 55 and 110 EMAs. Breakout will provide a clear directional bias. Focus on U.S. PPI data for impetus.


