


 Bitcoin Battles Volatility: Institutional Support Eyes USD 64,000 Floor Amid Geopolitical Tensions
  Ethereum Rises on Geopolitical De-escalation: Pezeshkian’s Peace Signal Ignites Bullish Momentum
  NZDJPY Bears Take Control: New Zealand Dollar Retreats as 92 Resistance Holds Firm
  EUR/JPY Bulls Charge: Eyeing 186.00 as Euro Strength Intensifies
  Bitcoin Recovers Amid Easing Geopolitics: Bulls Target USD 80,000 Support Rebound
  FxWirePro- Major Pair levels and bias summary
  FxWirePro: USD/CNY gains some ground but bearish outlook persists
  AUDJPY Pullback Intensifies: Resistance at 110.00 Signals Short Opportunity
  FxWirePro:NZD/USD drifts lower, could be on verge of bigger drop
  FxWirePro: EUR/AUD gaining momentum for a move towards 1.6800 level
  FxWirePro: USD/JPY firms as Trump's address on Gulf war spark fresh concerns
  FxWirePro- Woodies Pivot(Major)
  AUDJPY Pullback Intensifies: Resistance at 110.00 Signals Short Opportunity
  FxWirePro: GBP/NZD range to extend until there is game changing news
  Aussie Retreats Against the Yen: AUDJPY Bears Target 108 as 110 Resistance Holds Firm
  Ethereum Retreats Toward USD 2,000: Technicals Signal Caution as ETH Mimics Bitcoin’s Pullback
  FxWirePro- Major Crypto levels and bias summary


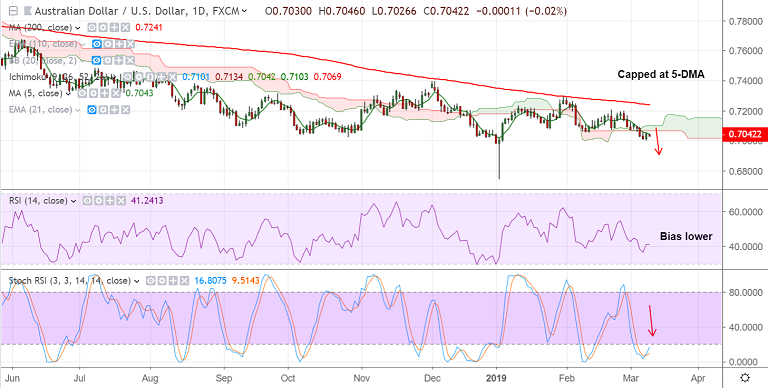
AUD/USD chart - Trading View
- AUD/USD is trading in a narrow range on the day, at 0.7041 at 0515 GMT.
- The pair has paused downside at 0.70 handle, we see weakness on break below.
- Poor economic data releases from Australia that have confirmed RBA's neutral-dovish bias.
- Also, no breakthrough between US/China trade talks keeps the antipodeans depressed.
- Further, China’s February trade figures surprised the market on the downside by a big margin, casting doubts on the economy's health, another dent to the AUD.
- Stochastics RSI indicator is at oversold levels, suggesting some pullback in the pair.
- Major trend in the pair is bearish and recovery attempts remain capped at 5-DMA.
- Break above 5-DMA could see upside till 21-EMA at 0.7096. Bearish invalidation only above 200-DMA.
- Break below 0.70 handle will see resumption on weakness. Next major support below 0.70 lies at 0.6907 (Sept 2015 low).
Support levels - 0.6907 (Sept 2015 low), 0.6827 (Jan 2016 low), 0.6744 (Jan 2019 low)
Resistance levels - 0.7069 (cloud base), 0.7103 (20-DMA), 0.7130 (55-EMA)
For details on FxWirePro's Currency Strength Index, visit http://www.fxwirepro.com/currencyindex.


