


 Bitcoin Surges Past USD 70,000 as Trump Signals De-escalation in US-Iran Conflict
  FxWirePro- Woodies Pivot(Major)
  FxWirePro- Major Pair levels and bias summary
  FxWirePro: USD/ CNY set for bigger drop, but close below key fibo needed
  Bearish Bias Persists: AUDJPY Technical Strategy Favors Selling on Rallies
  FxWirePro- Major Crypto levels and bias summary
  FxWirePro: USD/JPY edges higher but upside is limited
  FxWirePro- Major European Indices
  FxWirePro: USD/CNY rises as geopolitical risks drive dollar strength
  FxWirePro:NZD/USD edges higher but bearish outlook persists
  Double Bottom Recovery: NZDJPY Bulls Eye 94.18 as Geopolitical Tensions Ease
  FxWirePro: GBP/NZD gains some ground but bearish outlook persists
  FxWirePro: EUR/NZD recovers some ground but outlook is bearish
  FxWirePro- Major Crypto levels and bias summary
  FxWirePro:NZD/USD remains pressured, Fitch downgrades rating outlook


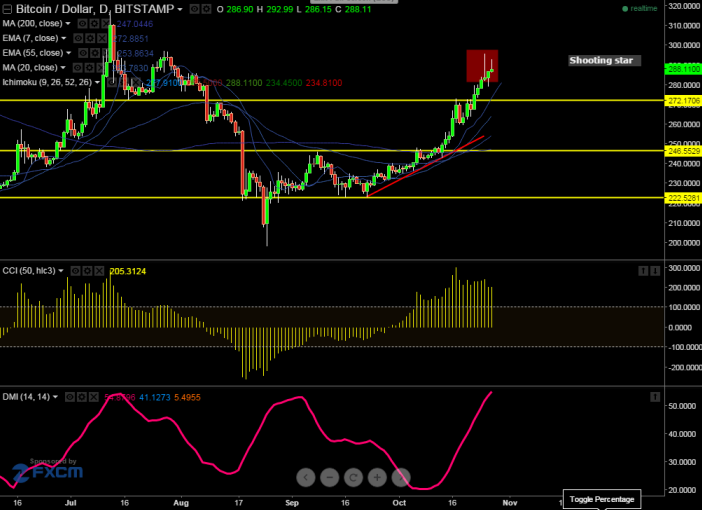
- BTC/USD has made a high of $296 and started to decline from that level. Short term trend is bearish as long as resistance $300 holds
- The pair's minor support is around $277 and any break below will drag the pair further down till $269/$258.
- On the higher side any break above $300 will take the pair till $310/$317.
Indicator (Daily chart)
CCI (50) -Buy
Ichimoku- Buy
We prefer to sell on rallies around $290-92 with SL at $300 for the TP of $277/$268.


