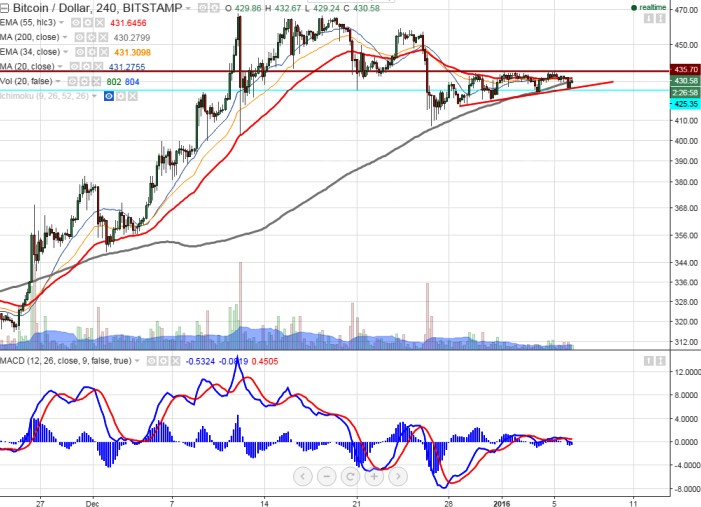
- Chart Pattern Formed- Ascending Triangle Pattern
- BTC/USD declined till $426 yesterday and recovered from that level. It is currently trading around $430.74
hort term trend is still bullish as long as support $400 holds. - The pair's minor resistance is around $436 and any break above will take the pair to next level till $480/$502 is possible. Overall trend reversal can be seen only below $400.
- On the lower side below $400 will drag the pair to next level $380/$ trend reversal only below $348.
It is good to buy at dips around $420 with SL around $400 for the TP of $465/$480


USDCHF Triple Bottom at 0.7920 Under Threat: Bearish Signals Dominate – Sell Rallies Targeting 0.7865
FxWirePro: GBP/AUD runs out of steam but maintains bullish outlook
FxWirePro: EUR/NZD uptrend loses steam but outlook still bullish
Aussie-Yen Holds Firm Post-BOJ Rate Boost: Intraday Bullish Momentum Intact
FxWirePro- Major Pair levels and bias summary
GBPJPY Rockets Post-BOJ Hike: Bullish Surge to 210 in Sight – Buy Dips Targeting 212
FxWirePro: GBP/USD dips lower on negative UK retail sales data
FxWirePro- Major Crypto levels and bias summary
FxWirePro: USD/CAD downtrend slows, but bearish sentiment remains
FxWirePro- Major Crypto levels and bias summary
CADJPY Pulls Back on Weak Canadian Retail Data: Dips to 113 Prime Buying Opportunity Targeting 116 


