


 FxWirePro- Major Pair levels and bias summary
  FxWirePro: GBP/AUD takes back some lost ground
  Pound on Pause: GBPJPY Bulls Regroup for a Potential Sprint Toward 215.00
  Euro Ascendant: EUR/USD Breaks $1.17 as Geopolitical Relief Sparks a Bullish Surge
  FxWirePro: GBP/USD bulls remain cautiously optimistic
  FxWirePro- Major Crypto levels and bias summary
  FxWirePro: USD/ZAR edges lower ,investors remain on edge
  FxWirePro: USD/CAD extends decline on broad dollar weakness
  FxWirePro: AUD/USD edged lower as early optimism over U.S.–Iran peace talks fade
  FxWirePro- Major Crypto levels and bias summary
  Ethereum Reclaims Higher Ground: Ether Bulls Target $2,700 as Middle East Tensions Thaw
  FxWirePro- Major Pair levels and bias summary
  FxWirePro:NZD/USD continues to recovers , upside pressure builds
  Bitcoin’s Islamabad Watch: BTCUSD Consolidates Near 71,421 USD as Geopolitical Peace Talks Loom
  FxWirePro: GBP/USD climbs to 4 -week high as ceasefire deal gives bulls traction
  Ethereum’s Healthy Correction: Bulls Eye Strategic Re-Entry at 2,150 USD Following Profit-Booking Pullback


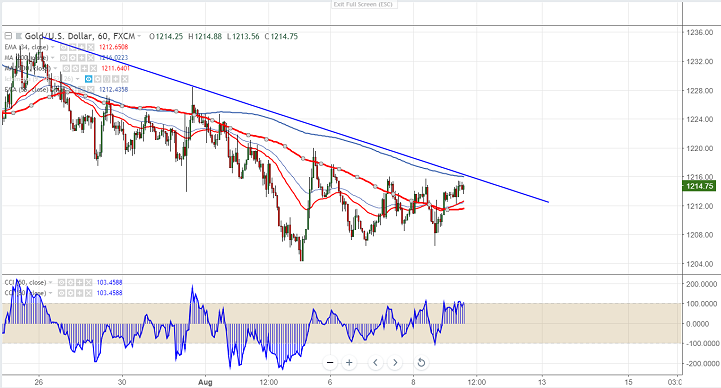
Gold is consolidating after a hitting 1 year low at $1204.69. The yellow metal hits low of $1204.69 on Jul 2017 and shown a good jump from that level.
In the hourly chart, gold is facing resistance at $1216-16.50 (200- H MA and trend line joining $1235.40 and $1228) and any break above will take the yellow metal to next level till $1220/$1228.
On the lower side, any break below $1211 (100- H MA) will drag the the yellow metal down till $1205/$1200.
USDJPY which is the major indicator for gold movement is currently trading weak. Gold and USDJPY has inverse relationship.
It is good to buy above $1216 with SL around $1210 for the TP of $1228.


