


 Oil Prices Dip Slightly Amid Focus on Russian Sanctions and U.S. Inflation Data
  Stock Futures Dip as Investors Await Key Payrolls Data
  UBS Predicts Potential Fed Rate Cut Amid Strong US Economic Data
  UBS Projects Mixed Market Outlook for 2025 Amid Trump Policy Uncertainty
  US Gas Market Poised for Supercycle: Bernstein Analysts
  China’s Growth Faces Structural Challenges Amid Doubts Over Data
  U.S. Treasury Yields Expected to Decline Amid Cooling Economic Pressures
  U.S. Banks Report Strong Q4 Profits Amid Investment Banking Surge
  Energy Sector Outlook 2025: AI's Role and Market Dynamics
  S&P 500 Relies on Tech for Growth in Q4 2024, Says Barclays
  China's Refining Industry Faces Major Shakeup Amid Challenges
  2025 Market Outlook: Key January Events to Watch
  Wall Street Analysts Weigh in on Latest NFP Data
  Indonesia Surprises Markets with Interest Rate Cut Amid Currency Pressure
  Bank of America Posts Strong Q4 2024 Results, Shares Rise
  Gold Prices Slide as Rate Cut Prospects Diminish; Copper Gains on China Stimulus Hopes


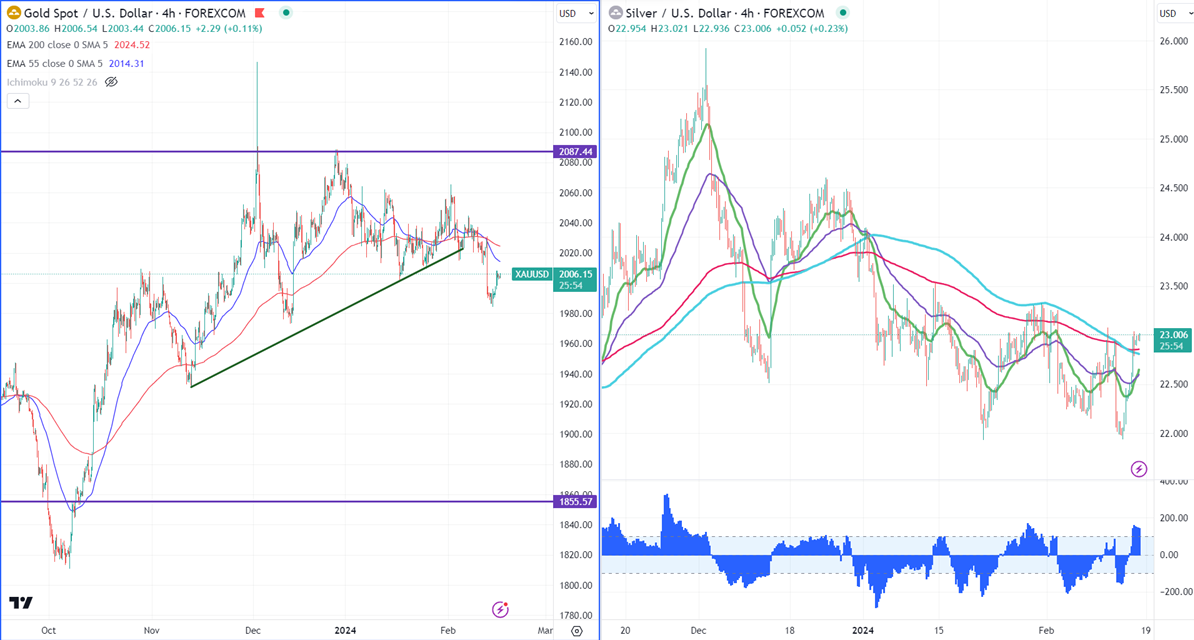
Gold -
Ichimoku Analysis (4-hour chart)
Tenken-Sen- $2019.77
Kijun-Sen- $2028.28
Gold jumped slightly after weak US retail sales. It came at -0.80% in Jan compared to a forecast of -0.20%. The yellow metal hit a high of $2008 yesterday and is currently trading around $2006.
The Empire State manufacturing index rose to -2.4 in Jan vs. the Forecast of -13.70, from -43.7 the previous month.
According to the CME Fed watch tool, the probability of a no-rate cut in Mar increased to 89.5% from 81% a week ago.
US dollar index- Bullish. Minor support around 104.50/103.80. The near-term resistance is 105/106.
Factors to watch for gold price action-
Global stock market- Bullish (negative for gold)
US dollar index - bullish (negative for gold)
US10-year bond yield- Bullish (negative for gold)
Technical:
The near–term support is around $1970, a break below targets of $1956/$1930. The yellow metal faces minor resistance around $2010 and a breach above will take it to the next level of $2020/$2030/$2045/$2060/$2070/$2080/$2100.
It is good to buy on dips around $1990 with SL around $1970 for TP of $2040/$2065/$2080.
Silver-
Silver recovered sharply on board-based US dollar selling. Any weekly close above $23.25 confirms further bullishness, a jump to $23.60/$24 is possible. It trades above 21, 55- EMA, and 200 EMA in the 4-hour chart. The near-term support is around $22.75 and a break below confirms an intraday bearishness. A dip to $22.20/$21.90/$21.40/$20.68 is possible.
Crude oil-
WTI crude oil is consolidating ahead of US PPI. Markets developments in the Middle East for further direction.
Major resistance- $78/$80. Significant support- $74/$72.


