


 Oil Prices Dip Slightly Amid Focus on Russian Sanctions and U.S. Inflation Data
  Lithium Market Poised for Recovery Amid Supply Cuts and Rising Demand
  US Gas Market Poised for Supercycle: Bernstein Analysts
  Moody's Upgrades Argentina's Credit Rating Amid Economic Reforms
  European Stocks Rally on Chinese Growth and Mining Merger Speculation
  2025 Market Outlook: Key January Events to Watch
  U.S. Stocks vs. Bonds: Are Diverging Valuations Signaling a Shift?
  Stock Futures Dip as Investors Await Key Payrolls Data
  UBS Projects Mixed Market Outlook for 2025 Amid Trump Policy Uncertainty
  U.S. Treasury Yields Expected to Decline Amid Cooling Economic Pressures
  Moldova Criticizes Russia Amid Transdniestria Energy Crisis
  Global Markets React to Strong U.S. Jobs Data and Rising Yields
  Trump’s "Shock and Awe" Agenda: Executive Orders from Day One
  Mexico's Undervalued Equity Market Offers Long-Term Investment Potential
  Wall Street Analysts Weigh in on Latest NFP Data
  China's Refining Industry Faces Major Shakeup Amid Challenges
  Bank of America Posts Strong Q4 2024 Results, Shares Rise


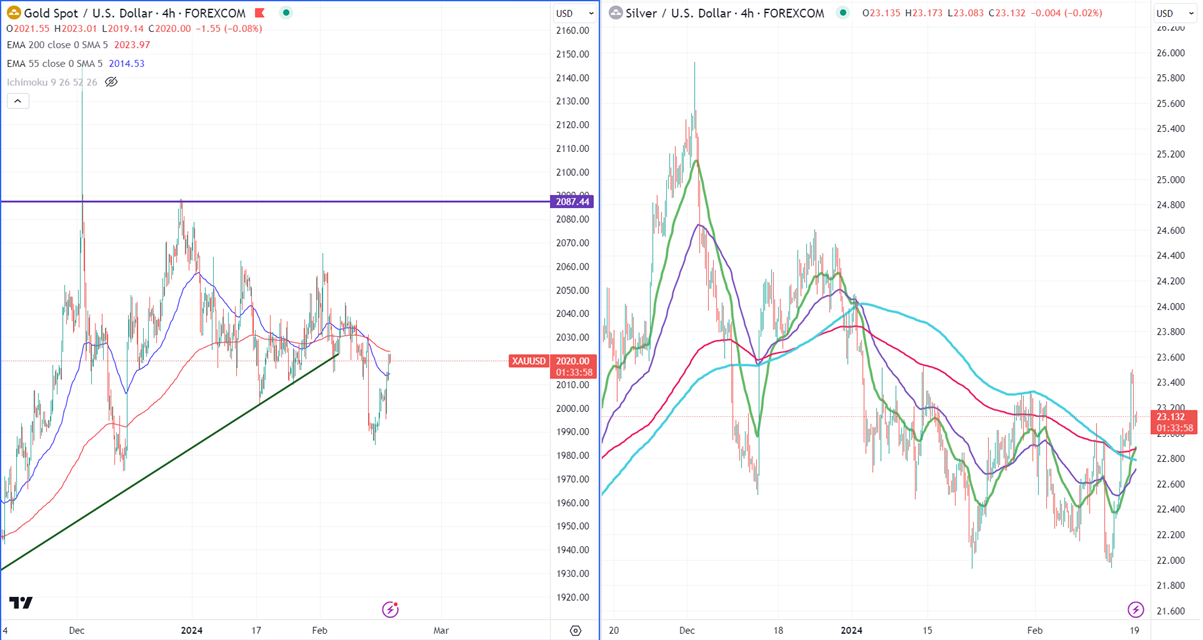
Gold -
Ichimoku Analysis (4-hour chart)
Tenken-Sen- $2005.14
Kijun-Sen- $2007.74
Gold gained above $2020 despite upbeat US inflation data. The US PPI came at 0.30% m/m compared to a forecast of 0.10%. The Core PPI surged to 0.050% vs. the Estimate of 0.10%. The yellow metal hit a high of $2023 at the time of writing and is currently trading around $2020.11.
The consumer sentiment released by Michigan Consumer sentiment improved from 79 in Jan to 79.6 in Feb.
According to the CME Fed watch tool, the probability of a no-rate cut in Mar increased to 89.5% from 84% a week ago.
US dollar index- Bullish. Minor support around 103.80/103. The near-term resistance is 105/106.
Factors to watch for gold price action-
Global stock market- Bullish (negative for gold)
US dollar index - bullish (negative for gold)
US10-year bond yield- Bullish (negative for gold)
Technical:
The near–term support is around $2000, a break below targets of $1970/$1956/$1930. The yellow metal faces minor resistance around $2030 and a breach above will take it to the next level of $2045/$2060/$2070/$2080/$2100.
It is good to buy on dips around $2000 with SL around $1970 for TP of $2065/$2080.
Silver-
Silver halted its three days of a bullish trend on the delay in a rate cut by the Fed. It trades above 21, 55- EMA, and 200 EMA in the 4-hour chart. The near-term support is around $22.75 and a break below confirms an intraday bearishness. A dip to $22.20/$21.90/$21.40/$20.68 is possible.
Crude oil-
WTI crude oil gained above $78 due to the escalation of Middle East tension. Any close above $80 confirms a bullish continuation.
Major resistance- $78/$80. Significant support- $74/$72.
a


