


 Fed May Resume Rate Hikes: BofA Analysts Outline Key Scenarios
  UBS Projects Mixed Market Outlook for 2025 Amid Trump Policy Uncertainty
  Gold Prices Slide as Rate Cut Prospects Diminish; Copper Gains on China Stimulus Hopes
  Mexico's Undervalued Equity Market Offers Long-Term Investment Potential
  China’s Growth Faces Structural Challenges Amid Doubts Over Data
  Energy Sector Outlook 2025: AI's Role and Market Dynamics
  Wall Street Analysts Weigh in on Latest NFP Data
  Urban studies: Doing research when every city is different
  Stock Futures Dip as Investors Await Key Payrolls Data
  US Gas Market Poised for Supercycle: Bernstein Analysts
  Geopolitical Shocks That Could Reshape Financial Markets in 2025
  Trump’s "Shock and Awe" Agenda: Executive Orders from Day One
  China's Refining Industry Faces Major Shakeup Amid Challenges
  Moldova Criticizes Russia Amid Transdniestria Energy Crisis
  Goldman Predicts 50% Odds of 10% U.S. Tariff on Copper by Q1 Close
  S&P 500 Relies on Tech for Growth in Q4 2024, Says Barclays


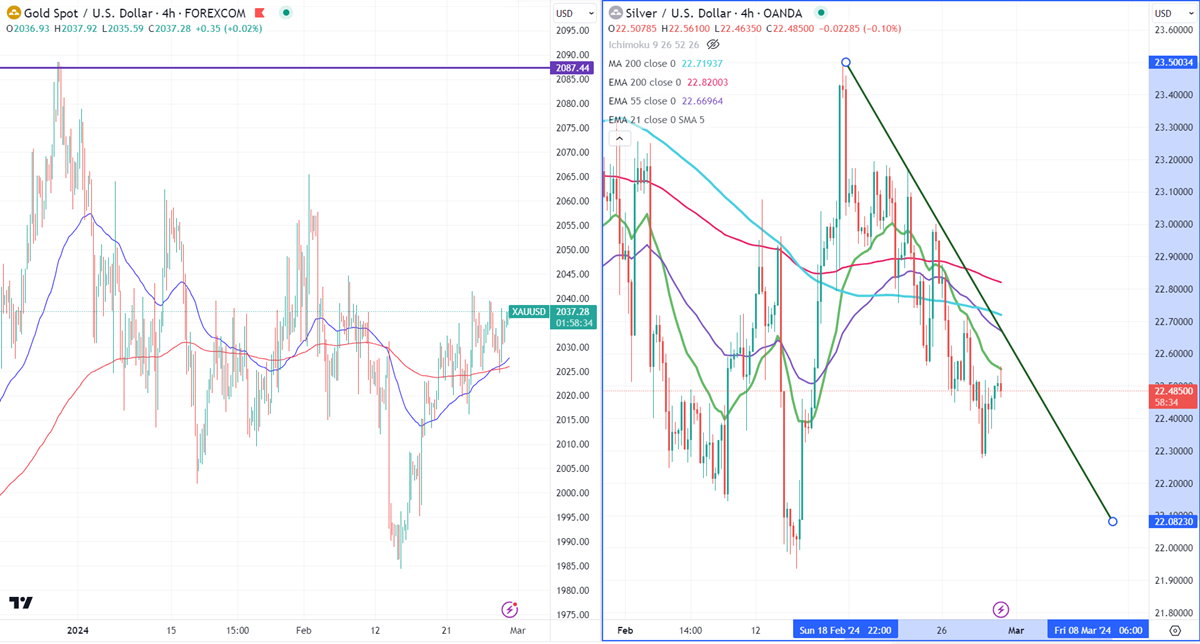
Gold -
Ichimoku Analysis (4-hour chart)
Tenken-Sen- $2033.27
Kijun-Sen- $2028.76
Gold showed a minor pullback, despite weak US GDP data. The United States' GDP grew at an annualized rate of 3.2% in Q4, missing market expectations of 3.3%. The yellow metal hit a high of $2037.92 at the time of writing and is currently trading around $2036.63.
Markets eye US PCE, Chicago PMI, and US jobless claims for further movement.
According to the CME Fed watch tool, the probability of a no-rate cut in Mar increased to 97.50% from 94% a week ago.
US dollar index- Bearish. Minor support around 103.40/102.70. The near-term resistance is 104.20/105.
Factors to watch for gold price action-
Global stock market- Bullish (negative for gold)
US dollar index - Bearish (Bullish for gold)
US10-year bond yield- Bullish (negative for gold)
Technical:
The near–term support is around $2020, a break below targets of $2010/$2000/$1970/$1956/$1930. The yellow metal faces minor resistance around $2042 and a breach above will take it to the next level of $2060/$2070/$2080/$2100.
It is good to buy on dips around $2000 with SL around $1970 for TP of $2065/$2080.
Silver-
Silver jumped slightly after hitting a two-week low of $22.27. The pair is edging towards a bearish channel resistance of $22.70-72. Any breach above that channel will push the Silver price to $23/23.50.
Major trend reversal level -$23.60.
Any strong violation above $23.60 confirms a bullish continuation. A jump to $24.20/$24.60 is possible.
It trades below 21, 55- EMA, and 200 EMA in the 4-hour chart. The near-term support is around $22.25 and a break below $22.20 targets $21.90/$21.40/$20.68.
Crude oil-
WTI crude oil pared some of its gains after touching a month high. The hopes for an extension of production cut by OPEC and geo-political tension in the Red Sea support crude oil at lower levels. Any jump above $80 confirms a further bullishness.
Major resistance-$80/$83. Significant support- $75.70/$74.


