


Chart - Courtesy Trading View
Technical Analysis: Bias Bearish
GMMA Indicator
- Shows strong bearish bias on near and long term moving averages on daily and intraday charts
Ichimoku Analysis
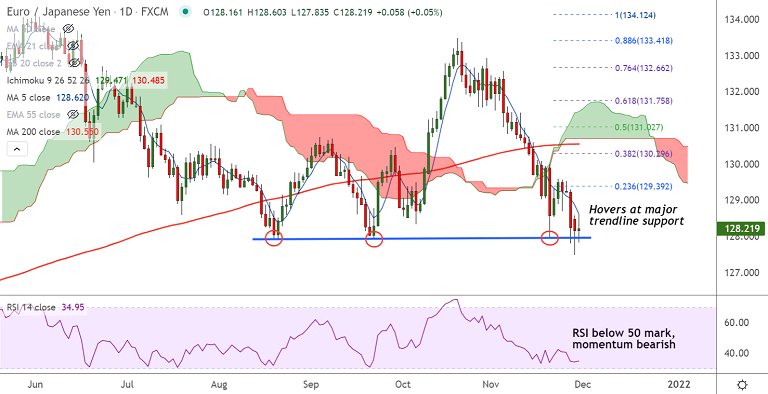
- Price action well below the daily cloud, Chikou span is biased lower
- The pair is extending break into the weekly cloud
Oscillators
- Stochs and RSI show strong bearish momentum
- RSI is well below the 50 mark and shows strength in the current downtrend
Bollinger Bands
- Bollinger bands are spread wide apart and are showing signs of further widening
- Volatility is hence high and rising, likely to add fuel to the downside momentum
Major Support Levels: 127.93 (trendline support), 127.15 (110-week EMA)
Major Resistance Levels: 128.63 (5-DMA), 128.84 (55-week EMA)
Summary: EUR/JPY has paused downside at major trendline support at 127.93. Decisive break below is required for downside continuation.


