


 FxWirePro- Major Pair levels and bias summary
  FxWirePro- Woodies Pivot(Major)
  FxWirePro- Major Crypto levels and bias summary
  FxWirePro: GBP/AUD gains some upside momentum but still bearish
  FxWirePro: USD/ZAR recovers slightly but trend is still bearish
  Energy Surge Ignites US Inflation: USDCHF Eyes Support Amid Dollar Sell-Off
  FxWirePro- Woodies Pivot(Major)
  FxWirePro: EUR/AUD downtrend loses steam but outlook still bearish
  FxWirePro- Major European Indices
  Euro Holds the Line: EURUSD Finds Support at the 365-EMA as Peace Talks Loom
  FxWirePro: GBP/USD biased higher but rally currently stretched
  FxWirePro- Major Pair levels and bias summary
  Bitcoin’s Volatile Reset: ETFs Rebound as Bulls Eye USD 80,000 Milestone
  Ethereum Consolidates: Bullish Technicals Point to a Potential $3,000 Breakout
  FxWirePro: USD/CAD extends decline on broad dollar weakness
  FxWirePro: AUD/USD retreats slightly but trend is still bullish
  FxWirePro: GBP/USD bulls remain cautiously optimistic


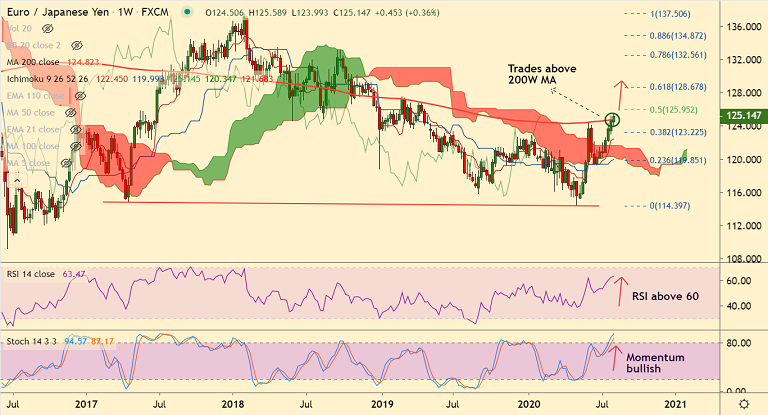
EUR/JPY chart - Trading View
EUR/JPY has slipped lower from fresh 16-month highs at 125.58 and was trading 0.09% lower on the day at 125.15 at around 09:00 GMT.
The pair is trading above 200W MA at 124.82 and weekly close above 200W MA will support further upside.
Technical indicators are strongly bullish. GMMA shows major and minor trend are strongly bullish on the daily charts.
Price action is above cloud and major moving averages. Oscillators show momentum is sharply bullish and AXD and MACD also support upside.
Next immediate hurdle aligns at 50% Fib at 125.95. Break above will see test of 200M MA at 130.54.
Support levels - 124.90 (5-DMA), 124.82 (200W MA)
Resistance levels - 125.95 (50% Fib), 127.50 (Feb 2019 high)


