


 Pound Under Pressure as Yen Stabilizes: GBPJPY Bears Target 208 as Key EMAs Hold Resistance
  EUR/JPY Bulls Charge: Eyeing 186.00 as Euro Strength Intensifies
  FxWirePro: USD/CAD runs out of steam but maintains bullish outlook
  FxWirePro: USD/CNY gains some ground but bearish outlook persists
  FxWirePro: EUR/AUD gaining momentum for a move towards 1.6800 level
  FxWirePro- Major Crypto levels and bias summary
  FxWirePro- Woodies Pivot(Major)
  Aussie Retreats Against the Yen: AUDJPY Bears Target 108 as 110 Resistance Holds Firm
  FxWirePro- Major Crypto levels and bias summary
  FxWirePro- Woodies Pivot(Major)
  FxWirePro: AUD/USD downside pressure builds, key support level in focus
  Euro Bulls Charge Past 1.1600: Broad Dollar Sell-Off Ignites Powerful EURUSD Rally
  Ethereum Retreats Toward USD 2,000: Technicals Signal Caution as ETH Mimics Bitcoin’s Pullback
  FxWirePro: EUR/ NZD steadies around 2.0150, retains bid tone
  Ethereum Rises on Geopolitical De-escalation: Pezeshkian’s Peace Signal Ignites Bullish Momentum
  Bitcoin Battles Volatility: Institutional Support Eyes USD 64,000 Floor Amid Geopolitical Tensions
  FxWirePro- Major European Indices


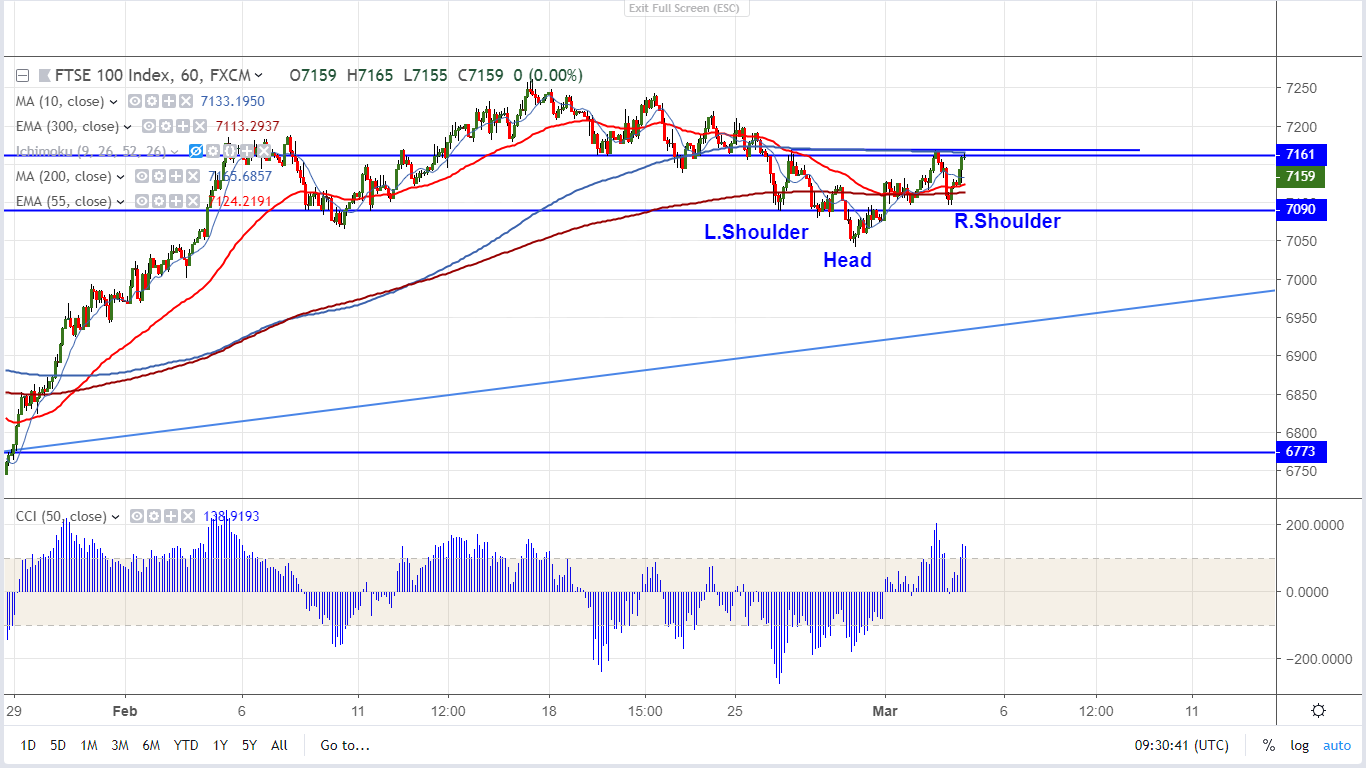
Chart pattern- Inverse head and Shoulder pattern
FTSE100 has once again recovered after declining slightly below 7100 level. The index hits low of 7097 yesterday and jumped till 7153.The index was trading weak and lost more than 3% after forming temporary top around 7262. The decline in GBP is supporting FTSE100 index currently and it has lost nearly 200 pips after forming temporary top around 1.3350.FTSE100 is currently trading around 7151.
On the higher side, the index is facing strong resistance around 7165-69 (200-H MA) and any break above this confirms minor bullishness and a jump till 7176/7215. The index should break above 7262 for further bullishness.
The near term support is around 7096 and any violation below targets 7065/7042. Any break below 7046 (300- 4 H EMA) confirms further bearishness.
It is good to buy on dips around 7135-40 with SL around 7095 for the TP of 7215/7262.


