


Ichimoku analysis (4 Hour Chart)
Tenken-Sen- $1785
Kijun-Sen- $ 1790
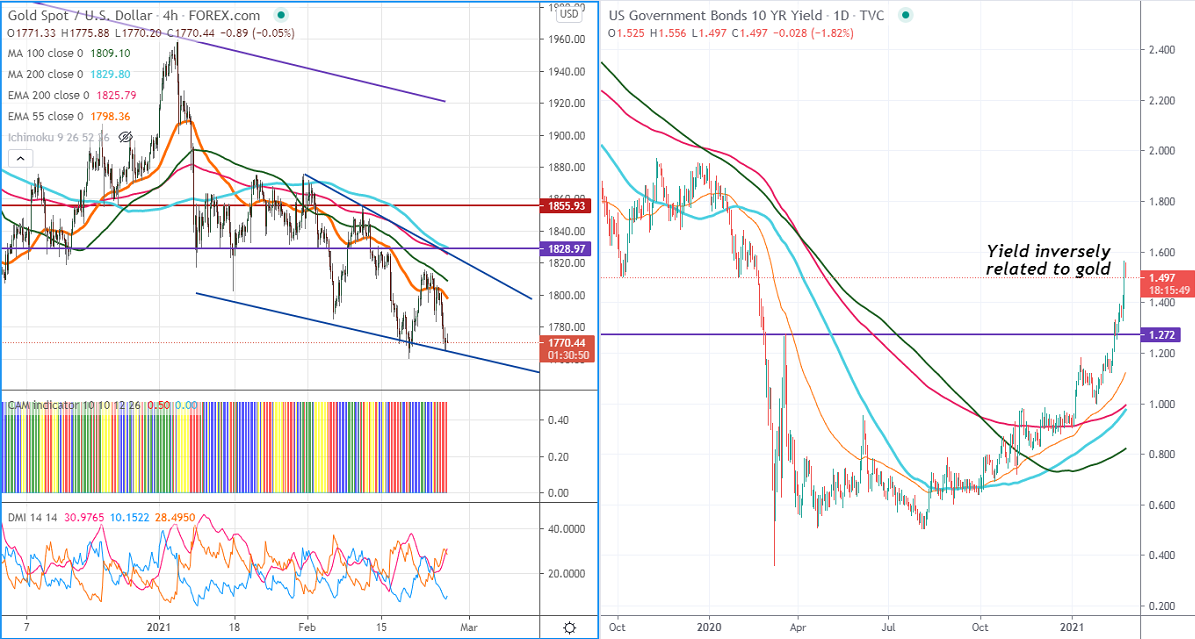
Gold continues to trade lower and hits 5- week low on surging US 10-year yield. The yield hits fresh year 1.56% on hopes of massive fiscal stimulus in the U.S to counter Coronavirus. The US dollar index recovered more than 50 pips from a low of 89.80 on rising yield. US Q4 GDP surged to 4.1% compared to a forecast of 4.2%. The number of people who have filed for unemployment benefits declined to 730k in the week ended Feb 20th vs an estimate of 828k. The short-term trend is bearish as long as resistance $1800 holds.
Technical:
The yellow metal is facing significant support at $1760, any indicative break below targets $1720/$1700. It is facing strong resistance at $1785.
Any violation above level will take the yellow till $1800/$1815. Minor bullish continuation only if it crosses $1815.
Indicator (4-hour chart)
CAM indicator – Bearish
Directional movement index – Bearish
It is good to sell on rallies around $1778-80 with SL around $1800 for the TP of $1717.


