


 AUDJPY Pullback Intensifies: Resistance at 110.00 Signals Short Opportunity
  FxWirePro:NZD/USD drifts lower, could be on verge of bigger drop
  Euro Bulls Charge Past 1.1600: Broad Dollar Sell-Off Ignites Powerful EURUSD Rally
  FxWirePro: EUR/ NZD steadies around 2.0150, retains bid tone
  FxWirePro: EUR/AUD gaining momentum for a move towards 1.6800 level
  FxWirePro: USD/ZAR fibo rejection triggers sizeable pullback
  FxWirePro- Major Crypto levels and bias summary
  FxWirePro- Major Pair levels and bias summary
  Bitcoin Recovers Amid Easing Geopolitics: Bulls Target USD 80,000 Support Rebound
  FxWirePro: AUD/USD gains some ground but remains sensitive to Middle East tensions
  FxWirePro: EUR/ NZD loses momentum but outlook is bullish
  AUDJPY Pullback Intensifies: Resistance at 110.00 Signals Short Opportunity
  FxWirePro: GBP/USD recovers but bears are not done yet again
  EUR/JPY Bulls Charge: Eyeing 186.00 as Euro Strength Intensifies
  FxWirePro: USD/CNY gains some ground but bearish outlook persists


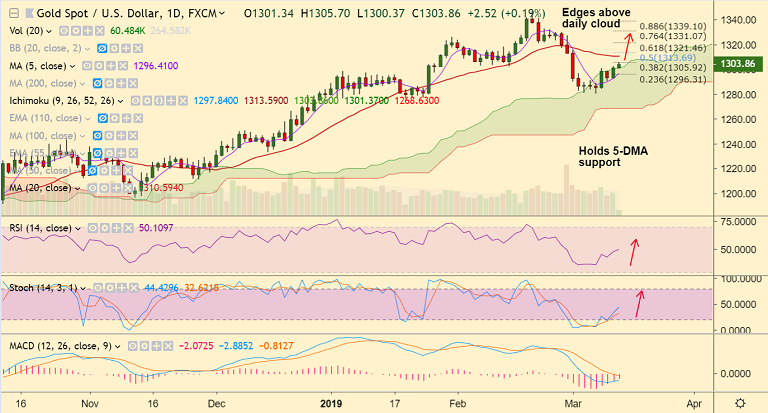
Gold chart - Trading View
- Brexit and U.S.-China trade developments keep safe-haven demand for yen underpinned.
- The yellow metal crossed 21-day exponential moving average (EMA) and is trading at 1304.22 at 0610 GMT.
- Price action has edged above daily cloud and we see scope for further gains.
- Technical studies on the daily charts are turning slightly bullish. MACD is on verge of bullish crossover on signal line.
- Stochs have rolled over from oversold levels and RSI has edged above 50, bias higher.
- Next bull target lies at 20-DMA at 1310.60 ahead of 50% Fib at 1313.69.
- 5-DMA is immediate support at 1296.42. Break below 55-EMA could see dip till 1276.70 (110-EMA).
Call update: Our previous call (https://www.econotimes.com/FxWirePro-Gold-Trade-Idea-Bullish-Divergence-and-1H-200-SMA-Breakout-1509340) has hit TP1/2.
Recommendation: Book partial profits at highs. Hold for further gains.
For details on FxWirePro's Currency Strength Index, visit http://www.fxwirepro.com/currencyindex.


