


 FxWirePro: EUR/AUD claws back some losses but rcovery likely muted
  FxWirePro: EUR/CAD gains ground on prospects of resumed energy flows
  FxWirePro: USD/ZAR edges lower ,investors remain on edge
  Ethereum Reclaims Higher Ground: Ether Bulls Target $2,700 as Middle East Tensions Thaw
  FxWirePro -Major European Indices
  Euro Ascendant: EUR/USD Breaks $1.17 as Geopolitical Relief Sparks a Bullish Surge
  FxWirePro- Major Crypto levels and bias summary
  Pound Sterling Power: GBP/JPY Secures Third Day of Gains as Global Risk Tensions Recede
  Bitcoin’s Islamabad Watch: BTCUSD Consolidates Near 71,421 USD as Geopolitical Peace Talks Loom
  FxWirePro- Major European Indices
  FxWirePro:NZD/USD continues to recovers , upside pressure builds
  FxWirePro: USD/ZAR slips sharply lower as US-Iran ceasefire lifts risk appetite
  Euro Holds the Line: EURUSD Finds Support at the 365-EMA as Peace Talks Loom
  Aussie Consolidates After Peak: AUDJPY Bulls Eye a Strategic Entry for the 115.00 Target
  Pound on Pause: GBPJPY Bulls Regroup for a Potential Sprint Toward 215.00
  Kiwi Ascendant: NZDJPY Bulls Eye Multi-Year Peaks Amid Triple-Day Rally


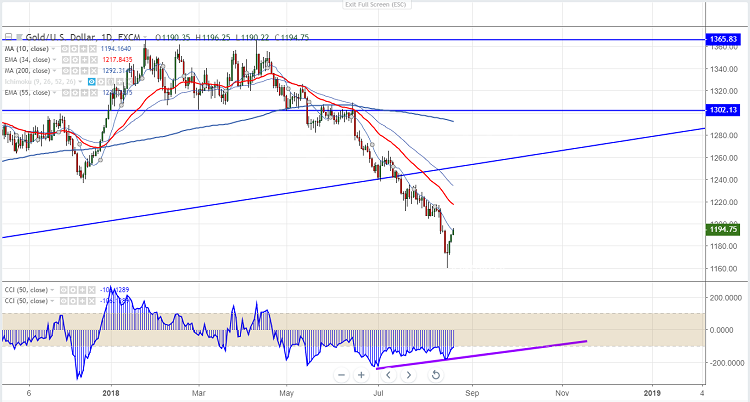
Major resistance- $1196 (10- day MA)
Bullish divergence - CCI(50) daily chart
The yellow metal has shown a good jump of almost $15 from the yesterday’s low of $1182. Gold hits high of $1196.25 and is currently trading around $1195.76.
Intraday trend is bullish as long as support $1183 holds. The near term intraday resistance is around $1196 and any break above targets $1200/$1207.
On the lower side, in the daily chart next immediate support is around $1183 5- day MA and $1178/$1173/$1170.
It is good to buy on dips around $1188-90 with SL around $1183 for the TP of $1207.


