


 U.S. Treasury Yields Expected to Decline Amid Cooling Economic Pressures
  FxWirePro: USD/ZAR sustains gains as uptrend remains strong
  Pound Under Pressure as Yen Stabilizes: GBPJPY Bears Target 208 as Key EMAs Hold Resistance
  EUR/JPY Bulls Charge: Eyeing 186.00 as Euro Strength Intensifies
  Ethereum Retreats Toward USD 2,000: Technicals Signal Caution as ETH Mimics Bitcoin’s Pullback
  Bitcoin Battles Volatility: Institutional Support Eyes USD 64,000 Floor Amid Geopolitical Tensions
  FxWirePro: USD/CNY gains some ground but bearish outlook persists
  Oil Prices Dip Slightly Amid Focus on Russian Sanctions and U.S. Inflation Data
  FxWirePro: EUR/ NZD consolidating around 2.0180 room for further gains
  China's Refining Industry Faces Major Shakeup Amid Challenges
  FxWirePro- Major Crypto levels and bias summary
  U.S. Stocks vs. Bonds: Are Diverging Valuations Signaling a Shift?
  NZDJPY Bears Take Control: New Zealand Dollar Retreats as 92 Resistance Holds Firm
  Fed May Resume Rate Hikes: BofA Analysts Outline Key Scenarios
  FxWirePro: AUD/USD downside pressure builds, key support level in focus


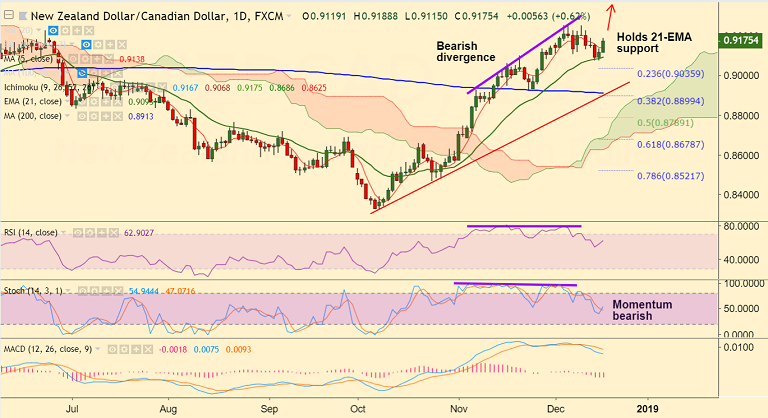
NZD/CAD chart on Trading View used for analysis
FxWirePro Currency Strength Index for NZD/CAD: Bias Bullish
FxWirePro's Hourly NZD Spot Index was at 100.667 (Bullish)
FxWirePro's Hourly CAD Spot Index was at -94.7994 (Bearish)
Technical Analysis: Bias Bullish
- Bounces off 21-EMA support, extends gains for the 2nd straight session
- Price action above cloud and major moving averages
- Breaks above 5-DMA at 0.9139
- Breaks above 1H 200 SMA, intraday charts are biased higher
Fundamental Factors:
- New Zealand Q3 GDP figures (due Wed) will drive price action if there is any significant surprise. Markets expect Q3 GDP to edge lower to 0.6% from 1.0% in the previous quarter.
- Focus also on Bank of Canada's (BoC) Consumer Price Index due Wednesday for further direction.
Support levels - 0.9139 (5-DMA), 0.9093 (21-EMA), 0.8982 (May 2 low)
Resistance levels - 0.9227 (Jun 22 high), 0.9251 (Dec 5, 11 high), 0.9275 (Apr 18 high)
Recommendation: Good to go long on dips around 0.9170, SL: 0.9135, TP: 0.92/ 0.9225/ 0.9250
For more details on FxWirePro's Currency Strength Index, visit http://www.fxwirepro.com/currencyindex.

- News

- Economy

- Central Banks
- Investing
- Research
- Roundups
- Digital Currency
- Insights
- Technical Analysis
- Technology
- Business
- Law
- Health
- Nature
- Fintech
- Science
- Topic
- Opinions
- ©Econometrics LLC . All Rights Reserved.
FxWirePro: NZD/CAD Trade Idea
Tuesday, December 18, 2018 4:20 AM UTC
Editor's Picks


- Market Data
Most Popular


