


 FxWirePro: USD/ZAR sustains gains as uptrend remains strong
  FxWirePro: USD/ZAR fibo rejection triggers sizeable pullback
  NZDJPY Bears Take Control: New Zealand Dollar Retreats as 92 Resistance Holds Firm
  Pound Under Pressure as Yen Stabilizes: GBPJPY Bears Target 208 as Key EMAs Hold Resistance
  FxWirePro: GBP/NZD range to extend until there is game changing news
  Euro Bulls Charge Past 1.1600: Broad Dollar Sell-Off Ignites Powerful EURUSD Rally
  Euro Retreats as Geopolitical Tensions Surge: EURUSD Eyes 1.1400 Floor Amid Safe-Haven Demand
  FxWirePro: USD/CAD runs out of steam but maintains bullish outlook
  FxWirePro: GBP/USD recovers but bears are not done yet again
  FxWirePro- Woodies Pivot(Major)
  FxWirePro- Woodies Pivot(Major)
  FxWirePro:NZD/USD drifts lower, could be on verge of bigger drop
  FxWirePro- Major European Indices
  Ethereum Rises on Geopolitical De-escalation: Pezeshkian’s Peace Signal Ignites Bullish Momentum
  FxWirePro- Major Pair levels and bias summary
  FxWirePro- Major Pair levels and bias summary


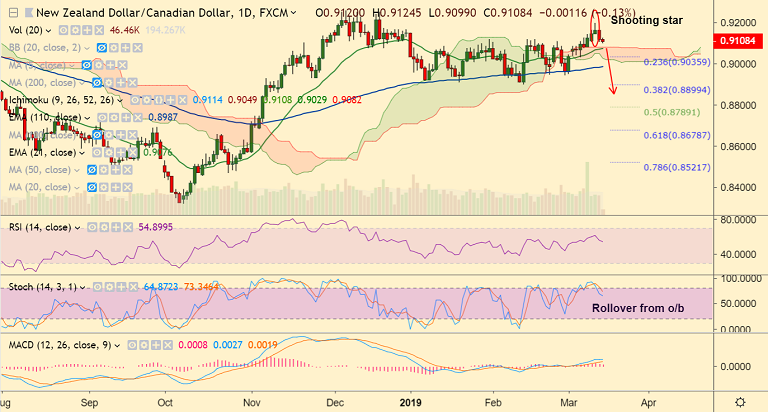
NZD/CAD chart - Trading View
- NZD/CAD is extending weakness for the 2nd straight session.
- The pair is trading 0.14% lower at 0.9106 at 0800 GMT, intraday bias bearish.
- Technical indicators on daily charts are turning bearish. Stochs are on verge of rollover from overbought levels.
- The pair has formed a 'Shooting Star' pattern on the daily charts which raises scope for weakness.
- We see immediate support at daily cloud at 0.9082. Break into cloud will see extension of weakness.
- Price is consolidating dip below 200-SMA. Retrace above could see minor upside.
Support levels - 0.9082 (cloud top), 0.9076 (21-EMA), 0.9039 (55-EMA)
Resistance levels - 0.9108 (200-hour SMA), 0.9132 (5-DMA), 0.9197 (Mar 12 high)
For details on FxWirePro's Currency Strength Index, visit http://www.fxwirepro.com/currencyindex.


