


 EUR/JPY Bulls Charge: Eyeing 186.00 as Euro Strength Intensifies
  China's Refining Industry Faces Major Shakeup Amid Challenges
  Urban studies: Doing research when every city is different
  Moody's Upgrades Argentina's Credit Rating Amid Economic Reforms
  Oil Prices Dip Slightly Amid Focus on Russian Sanctions and U.S. Inflation Data
  Bank of America Posts Strong Q4 2024 Results, Shares Rise
  FxWirePro: GBP/USD recovers but bears are not done yet again
  Indonesia Surprises Markets with Interest Rate Cut Amid Currency Pressure
  Trump’s "Shock and Awe" Agenda: Executive Orders from Day One
  S&P 500 Relies on Tech for Growth in Q4 2024, Says Barclays
  Energy Sector Outlook 2025: AI's Role and Market Dynamics
  Global Markets React to Strong U.S. Jobs Data and Rising Yields
  2025 Market Outlook: Key January Events to Watch
  FxWirePro: EUR/ NZD steadies around 2.0150, retains bid tone
  US Gas Market Poised for Supercycle: Bernstein Analysts
  Lithium Market Poised for Recovery Amid Supply Cuts and Rising Demand


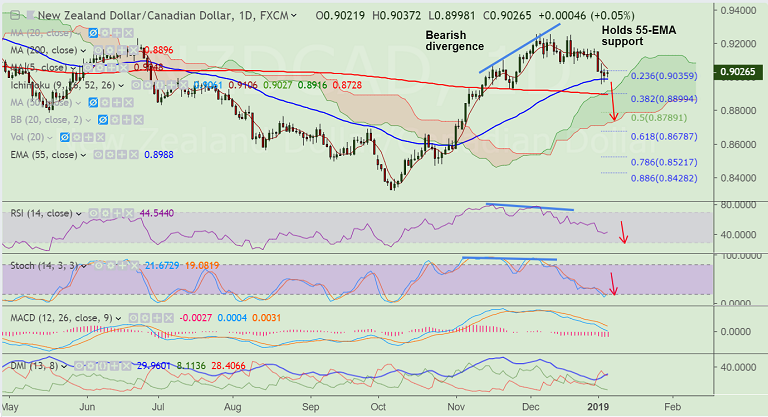
NZD/CAD chart on Trading View used for analysis
- NZD/CAD extends range trade at 55-EMA support.
- Positive news related to the US-China trade war alongside China's announcement of more stimulus measures coming from the banking sector support antipodeans.
- Back-to-back spinning top formations suggest lack of direction.
- Price action has slipped below 21-EMA support and bearish divergence on RSI and Stochs keeps bearish bias.
- Upside lacks traction, doji formation seen on daily candle. Immediate resistance lies at 5-DMA. Break above to see minor upside.
- Break below 55-EMA to see dip till next bear target at 200-DMA at 0.89. Violation there will see test of 61.8% Fib at 0.8678.
Support levels - 0.8988 (55-EMA), 0.89 (converged 200-DMA and 38.2% Fib), 0.8789 (50% Fib), 0.8678 (61.8% Fib)
Resistance levels - 0.9048 (5-DMA), 0.9087 (21-EMA), 0.92, 0.9256 (Dec high)


