


 Euro Bulls Charge Past 1.1600: Broad Dollar Sell-Off Ignites Powerful EURUSD Rally
  FxWirePro- Major European Indices
  FxWirePro- Major Pair levels and bias summary
  AUDJPY Pullback Intensifies: Resistance at 110.00 Signals Short Opportunity
  FxWirePro: USD/CAD runs out of steam but maintains bullish outlook
  FxWirePro: AUD/USD gains some ground but remains sensitive to Middle East tensions
  Ethereum Rises on Geopolitical De-escalation: Pezeshkian’s Peace Signal Ignites Bullish Momentum
  NZDJPY Technical Outlook: Bearish Bias Deepens as Key Resistances Hold
  FxWirePro: GBP/USD recovers but bears are not done yet again
  NZDJPY Bears Take Control: New Zealand Dollar Retreats as 92 Resistance Holds Firm
  FxWirePro: GBP/NZD range to extend until there is game changing news
  FxWirePro:NZD/USD drifts lower, could be on verge of bigger drop
  Bitcoin Recovers Amid Easing Geopolitics: Bulls Target USD 80,000 Support Rebound
  Yen Resurgence Drives GBPJPY to 2.5-Week Low: Sellers Aim for 208.00
  FxWirePro: AUD/USD downside pressure builds, key support level in focus
  FxWirePro- Woodies Pivot(Major)


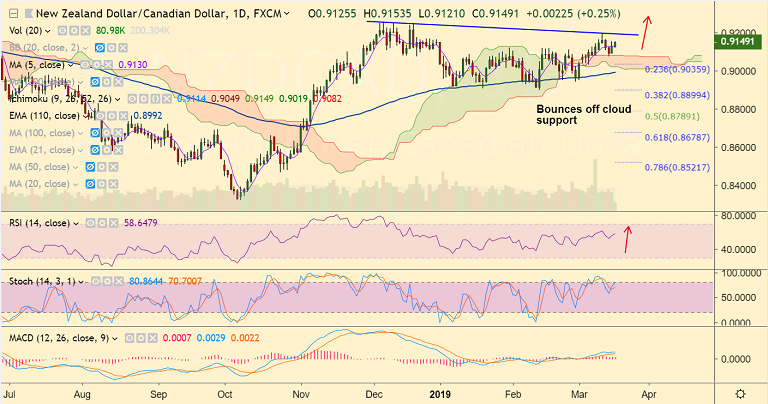
NZD/CAD chart - Trading View
- NZD/CAD has bounced off cloud support, is extending gains for the 2nd straight session.
- The pair is trading 0.22% higher at 0.9148, intraday bias higher.
- Technical studies support upside. RSI above 50, momentum with the bulls.
- Weekly charts also show bullish momentum. Price is extending gains above 200-W SMA.
- Scope for test of 0.9195 (trendline resistance). Break above to see further gains.
- Immediate support is seen at 5-DMA at 0.9130. Break below will see dip till daily cloud.
- Breach at daily cloud could see weakness till 110-EMA at 0.8992.
Support levels - 0.9130 (5-DMA), 0.9035 (23.6% Fib), 0.8992 (110-EMA)
Resistance levels - 0.9195 (trendline), 0.9250 (Dec 19 high), 0.9312 (61.8% Fib)
For details on FxWirePro's Currency Strength Index, visit http://www.fxwirepro.com/currencyindex.


