


 FxWirePro: USD/ZAR slips sharply lower as US-Iran ceasefire lifts risk appetite
  FxWirePro- Major Pair levels and bias summary
  NZD/JPY Rockets as Kiwi Dollar Resilience Defies the Oil Shock
  FxWirePro: USD/ JPY slips as yen rallies after Mideast ceasefire declaration
  FxWirePro: EUR/AUD claws back some losses but rcovery likely muted
  FxWirePro: EUR/NZD remains under pressure as key support gives way
  FxWirePro- Major Pair levels and bias summary
  Ethereum Reclaims Higher Ground: Ether Bulls Target $2,700 as Middle East Tensions Thaw
  Aussie Bulls Charge: AUD/JPY Rallies as Geopolitical Clouds Part
  FxWirePro- Major Crypto levels and bias summary
  EUR/JPY Breaks Out: Euro Surges Past 185.00 Resistance Amid Strong Bullish Momentum
  FxWirePro- Woodies Pivot(Major)
  FxWirePro- Major European Indices
  FxWirePro: USD/CNY falls to three-year high, scope for further downside
  FxWirePro: GBP/AUD takes back some lost ground


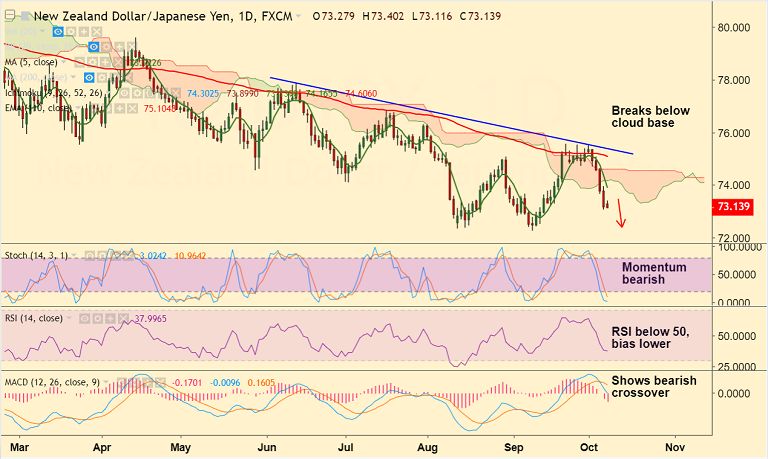
NZD/JPY chart on Trading View used for analysis
- NZD/JPY is trading in a narrow range on the day, with day's high at 73.402 and low at 73.116.
- The pair has broken below daily cloud in the previous weeks trade and we see scope for further weakness.
- Technical indicators are bearishly aligned with downward sloping RSI and Stochs and bearish MACD crossover on signal line.
- Price is hovering around 73.20 (Sept 17 low), 72.25 (Sept 10 low), break below to see dip till 72.25 (Sept 10 low).
- We see bearish invalidation only above 110-EMA at 75.10.
Support levels - 73.20 (Sept 17 low), 72.25 (Sept 10 low)
Resistance levels - 74.50 (55-EMA), 74.85 (5-DMA), 75.18 (110-EMA)
Call update: Our previous call (https://www.econotimes.com/FxWirePro-NZD-JPY-holds-support-at-cloud-base-good-to-go-short-on-break-below-1438668) has hit TP1.
Recommendation: Book partial profits. Hold for further weakness.
FxWirePro Currency Strength Index: FxWirePro's Hourly NZD Spot Index was at -117.309 (Bearish), while Hourly JPY Spot Index was at 129.205 (Bullish) at 0830 GMT.
For more details on FxWirePro's Currency Strength Index, visit http://www.fxwirepro.com/currencyindex.


