


 EUR/JPY Breaks Out: Euro Surges Past 185.00 Resistance Amid Strong Bullish Momentum
  FxWirePro- Major European Indices
  FxWirePro: GBP/USD stuck in range but maintains bearish bias
  FxWirePro- Major Pair levels and bias summary
  FxWirePro: EUR/NZD remains under pressure as key support gives way
  FxWirePro- Major Crypto levels and bias summary
  FxWirePro: GBP/USD climbs to 4 -week high as ceasefire deal gives bulls traction
  FxWirePro: EUR/ NZD downside pressure builds, key support level in focus
  FxWirePro: USD/ZAR continues to recovers , upside pressure builds
  Aussie Bulls Charge: AUD/JPY Rallies as Geopolitical Clouds Part
  Ethereum Reclaims Higher Ground: Ether Bulls Target $2,700 as Middle East Tensions Thaw
  FxWirePro: GBP/AUD takes back some lost ground
  FxWirePro: EUR/AUD falls below 1.6600 level, plunge to test a key fibo grows
  FxWirePro- Major Pair levels and bias summary
  Pound Sterling Power: GBP/JPY Secures Third Day of Gains as Global Risk Tensions Recede


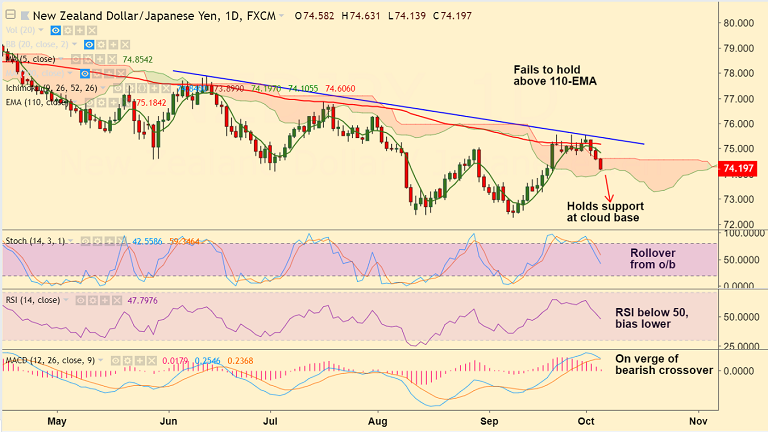
NZD/JPY chart on Trading View used for analysis
- NZD/JPY is extending weakness for the 3rd straight session, bias lower.
- Technical analysis supports weakness. Price action has fallen below major EMAs.
- Stochs have rolled over from overbought levels. RSI has fallen below 50 levels and bias is lower.
- MACD is on verge of a bearish crossover on signal line which if completed will add to the bearish bias.
- Upside has failed to hold break above 110-EMA, slips below 21-EMA.
- Price is holding support at daily cloud base, break below will see further weakness.
- We see bearish invalidation only on breakout above 110-EMA.
Support levels - 74.10 (cloud base), 73.20 (Sept 17 low), 72.25 (Sept 10 low)
Resistance levels - 74.50 (55-EMA), 74.85 (5-DMA), 75.18 (110-EMA)
Recommendation: Stay short on break below daily cloud, SL: 74.50, TP: 73.20/ 72.25.
FxWirePro Currency Strength Index: FxWirePro's Hourly NZD Spot Index was at -32.9275 (Neutral), while Hourly JPY Spot Index was at 27.0931 (Neutral) at 1145 GMT.
For more details on FxWirePro's Currency Strength Index, visit http://www.fxwirepro.com/currencyindex.


