


 Aussie Consolidates After Peak: AUDJPY Bulls Eye a Strategic Entry for the 115.00 Target
  FxWirePro: GBP/USD bulls remain cautiously optimistic
  FxWirePro: GBP/AUD positions for another drop, eyes 1.8900level
  FxWirePro: EUR/CAD gains ground on prospects of resumed energy flows
  FxWirePro- Major Pair levels and bias summary
  FxWirePro: USD/JPY steadies around 158.75, bias bullish
  FxWirePro- Woodies Pivot(Major)
  FxWirePro: USD/ZAR edges lower ,investors remain on edge
  FxWirePro: AUD/USD edged lower as early optimism over U.S.–Iran peace talks fade
  FxWirePro- Major Pair levels and bias summary
  FxWirePro: USD/CAD extends decline on broad dollar weakness
  FxWirePro: GBP/USD climbs to 4 -week high as ceasefire deal gives bulls traction
  FxWirePro- Major Crypto levels and bias summary
  Euro Ascendant: EUR/USD Breaks $1.17 as Geopolitical Relief Sparks a Bullish Surge
  Bitcoin’s Islamabad Watch: BTCUSD Consolidates Near 71,421 USD as Geopolitical Peace Talks Loom


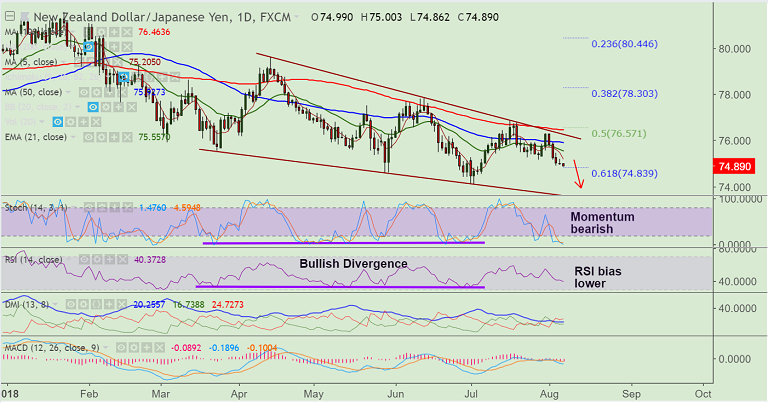
Refer NZD/JPY chart on Trading View
- NZD/JPY is trading in a narrow range, with a day's high at 75.00 and low at 74.86.
- The pair is extending declines for the 5th straight session and bias remains bearish.
- Technical studies support further downside in the pair. Stochs and RSI show weakness.
- Focus now on RBNZ policy meet, where a dovish outcome could weigh on the bird.
- Price action currently holds support at 61.8% Fib and break below will see drag lower.
- We then see scope for test of trendline support at 73.60 ahead of 78.6% Fib at 72.37.
- On the flipside, 5-DMA is immediate resistance at 75.20. Bearish invalidation only above 110-EMA.
Support levels - 74.83 (61.8% Fib), 73.60 (trendline), 72.37 (78.6% Fib)
Resistance levels - 75.20 (5-DMA), 75.56 (21-EMA), 75.93 (55-EMA), 76.55 (110-EMA)
Recommendation: Good to go short on break below 61.8% Fib, SL: 75.20, TP: 73.60/ 73/ 72.40
FxWirePro Currency Strength Index: FxWirePro's Hourly NZD Spot Index was at -75.1272 (Neutral), while Hourly JPY Spot Index was at 137.089 (Bullish) at 0430 GMT. For more details on FxWirePro's Currency Strength Index, visit http://www.fxwirepro.com/currencyindex.


