


 Global Markets React to Strong U.S. Jobs Data and Rising Yields
  U.S. Treasury Yields Expected to Decline Amid Cooling Economic Pressures
  FxWirePro- Major Crypto levels and bias summary
  European Stocks Rally on Chinese Growth and Mining Merger Speculation
  FxWirePro: EUR/ NZD consolidating around 2.0180 room for further gains
  2025 Market Outlook: Key January Events to Watch
  Gold Prices Slide as Rate Cut Prospects Diminish; Copper Gains on China Stimulus Hopes
  Wall Street Analysts Weigh in on Latest NFP Data
  Fed May Resume Rate Hikes: BofA Analysts Outline Key Scenarios
  NZDJPY Bears Take Control: New Zealand Dollar Retreats as 92 Resistance Holds Firm
  Oil Prices Dip Slightly Amid Focus on Russian Sanctions and U.S. Inflation Data
  China’s Growth Faces Structural Challenges Amid Doubts Over Data
  FxWirePro: EUR/AUD eases slightly but trend is still bullish
  Trump’s "Shock and Awe" Agenda: Executive Orders from Day One
  Goldman Predicts 50% Odds of 10% U.S. Tariff on Copper by Q1 Close
  Moody's Upgrades Argentina's Credit Rating Amid Economic Reforms


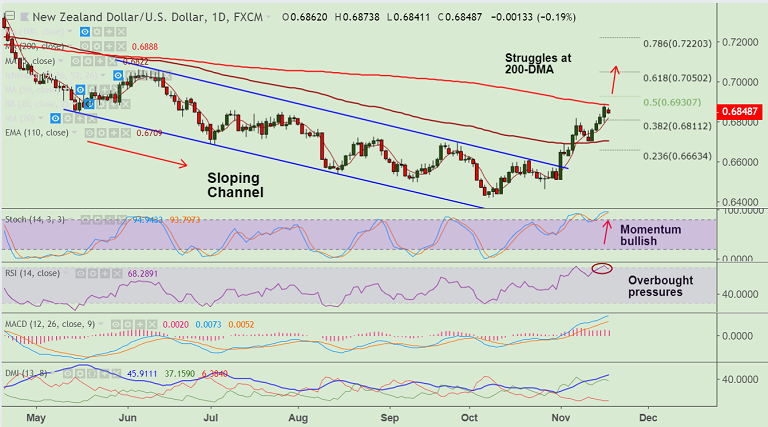
NZD/USD chart on Trading View used for analysis
- NZD/USD slips further from 5-month high at 0.6883 hit on Friday's trade.
- The pair is struggling at stiff resistance at 200-DMA, further upside only on break above.
- We see some overbought pressures on momentum indicators which suggests possibility of pullbacks.
- Immediate support lies at 5-DMA at 0.6820, break below to see dip till 110-EMA at 0.6709.
- On the upside, breakout at 200-DMA to see test of 61.8% Fib at 0.7050.
Support levels - 0.6820 (5-DMA), 0.6709 (110-EMA)
Resistance levels - 0.6888 (200-DMA), 0.7050 (61.8% Fib)
For details on FxWirePro's Currency Strength Index, visit http://www.fxwirepro.com/currencyindex.


