


 FxWirePro- Woodies pivot (Major)
  AUDJPY Dip-Buy Setup: 113.58 Entry Aims for 115
  FxWirePro- Major Pair levels and bias summary
  FxWirePro: EUR/AUD edges higher but bearish outlook persists
  FxWirePro: GBP/USD falls as fragile ceasefire keeps investors on edge
  FxWirePro: GBP/NZD downtrend loses momentum but bearish setup remains
  FxWirePro- Major Crypto levels and bias summary
  GBPJPY Rises on Solid UK Data: Dip-Buy Setup at 214.6 Eyes 217
  FxWirePro: GBP/NZD continues to recovers , upside pressure builds
  FxWirePro- Major Pair levels and bias summary
  FxWirePro-Major European Indices
  Bitcoin Flat Near 77k as US-Iran Tensions Escalate; ETF Inflows Near $1B for the Week
  FxWirePro: USD/ JPY remains buoyant, looks to extend gains
  FxWirePro: USD/ZAR slips as rand gains on peace talk hopes
  FxWirePro: NZD/USD edges lower as Geopolitical risks keep risk sentiment fragile
  FxWirePro- Major Crypto levels and bias summary
  FxWirePro: GBP/USD gains on upbeat UK retail sales data


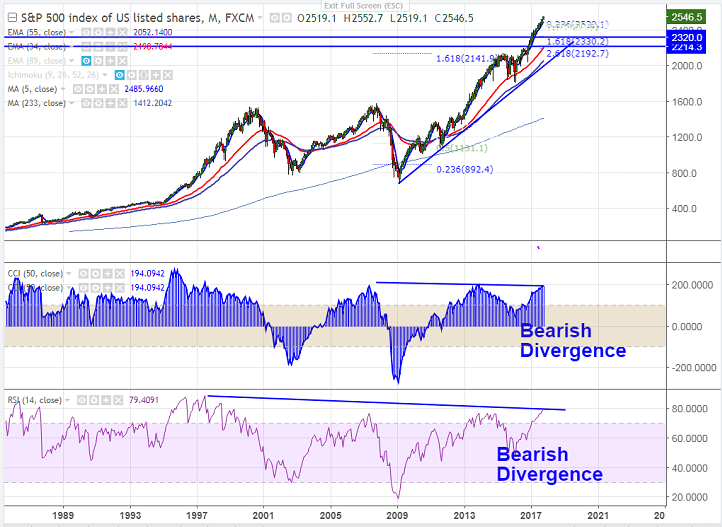
- Chart Pattern formed – Bearish divergence (RSI and CCI (50) in Monthly chart).
- S&P500 has touched record high at 2552 on Oct 5th and is consolidating slightly from that level. The index hits low of 2541 and is currently trading around 2546.
- The index near term support is around 2540 and any break below will take the index to next level till 2520 (23.6% retracement of 2416 and 2552)/2500/2459 (5- month MA).Any bearish continuation only below 2416 (Aug 18th 2017 low).
- On the higher side, near term resistance is around 2553 and any break above will take the pair to 2585/2600.
- In the monthly chart the index has formed bearish divergence in RSI and CCI (50) and a slight dip till 2500/2460 likely.
It is good to sell on rallies around 2550 with SL around 2565 for the TP of 2520/2501.


