


 UBS Projects Mixed Market Outlook for 2025 Amid Trump Policy Uncertainty
  Indonesia Surprises Markets with Interest Rate Cut Amid Currency Pressure
  Moody's Upgrades Argentina's Credit Rating Amid Economic Reforms
  China’s Growth Faces Structural Challenges Amid Doubts Over Data
  U.S. Stocks vs. Bonds: Are Diverging Valuations Signaling a Shift?
  BTC Flat at $89,300 Despite $1.02B ETF Exodus — Buy the Dip Toward $107K?
  Urban studies: Doing research when every city is different
  US Futures Rise as Investors Eye Earnings, Inflation Data, and Wildfire Impacts
  Mexico's Undervalued Equity Market Offers Long-Term Investment Potential


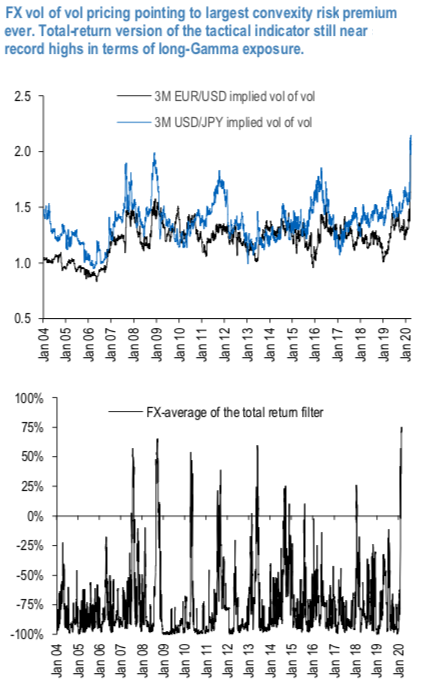
The rather extreme conditions as experienced by the FX vol market are confirmed when looking at the so-called vol-of- vol parameters, a measure of convexity smile risk for different pairs (Exhibit 2, top). While pricing of vols remains generally well below that observed at the 2008 highs, this measure of convexity risk largely overshoots, at least for liquid pairs, the previous peak which took place at the peak of the 2008 GFC.
This picture is fully consistent with the results of a tactical model for vol trading (Total-return version of tactical filter allowing long Gamma trades), whose recommended long-Gamma signals is highest on record (refer 1stchart), after averaging over USD G10 and EM pairs, again surpassing the GFC and European debt crisis. The model relies on a set of common global indicators and other variables that depend on each vol smile. At present, 4 of the global indicators (Ted spreads, VIX, Gold/Silver and VXY) indicate a risk-off market, with only US swaptions pointing to benign sentiment.
The model had started deleveraging risk towards mid- February, before going overall long Gamma, between end of Feb – early March, depending on the currency.
By construct the model cumulates positions over a month (each trade is kept until expiry), thus there is typically a lag of a few weeks between the reduction of risk from the signals to the resulting cumulated positions in the portfolios. At present, the cumulated positions are in long Gamma territory, but less exposed than what latest signals would point to (refer 2nd chart).


