


 FxWirePro: USD/JPY firms as Trump's address on Gulf war spark fresh concerns
  FxWirePro: AUD/USD downside pressure builds, key support level in focus
  NZDJPY Bears Take Control: New Zealand Dollar Retreats as 92 Resistance Holds Firm
  FxWirePro- Woodies Pivot(Major)
  FxWirePro- Major European Indices
  EUR/JPY Bulls Charge: Eyeing 186.00 as Euro Strength Intensifies
  FxWirePro: USD/JPY neutral in the near-term, scope for downward resumption
  Ethereum Rises on Geopolitical De-escalation: Pezeshkian’s Peace Signal Ignites Bullish Momentum
  FxWirePro- Major Pair levels and bias summary
  FxWirePro:NZD/USD drifts lower, could be on verge of bigger drop
  FxWirePro: USD/CAD runs out of steam but maintains bullish outlook
  FxWirePro: USD/CNY gains some ground but bearish outlook persists
  FxWirePro: EUR/AUD gaining momentum for a move towards 1.6800 level
  FxWirePro: USD/ZAR fibo rejection triggers sizeable pullback
  FxWirePro- Major Crypto levels and bias summary
  Ethereum Retreats Toward USD 2,000: Technicals Signal Caution as ETH Mimics Bitcoin’s Pullback


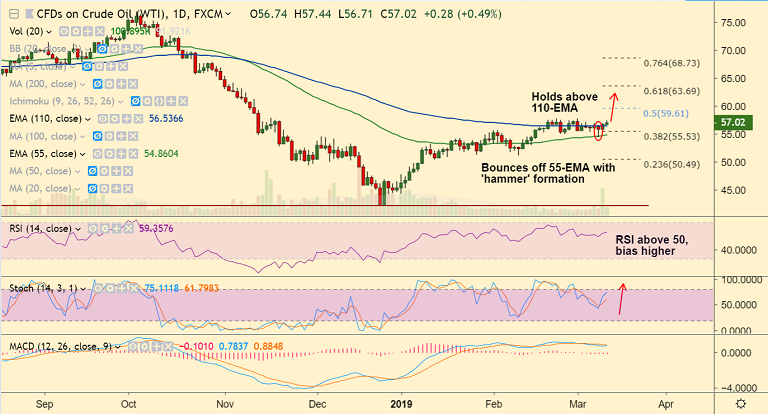
U.S. oil chart - Trading View
- U.S. oil breaks above 110-EMA which was capping upside from many sessions.
- Increased expectations of tightening oil markets added to the bullish tone.
- OPEC’s de facto leader Saudi Arabia looks set to deepen the cartel’s supply cuts.
- The pair trades marginally higher on the day at 57.04 at 1155 GMT.
- Price action has bounced off 55-EMA with a 'hammer' formation. We see weakness only below 55-EMA.
- Technical indicators have turned slightly bullish. Decisive break above 110-EMA has raised scope for further gains.
- Next major resistance above 110-EMA lies at 50% Fib at 59.60. Focus now on API, EIA data for further impetus.
- Retrace below 110-EMA will see test of 55-EMA. Break below 55-EMA can see dip till daily cloud.
Support levels - 56.53 (110-EMA), 55.53 (38.2% Fib), 54.85 (55-EMA)
Resistance levels - 57.85 (Mar 1 high), 59.61 (50% Fib), 61.97 (200-DMA)
Call update: Our previous call (https://www.econotimes.com/FxWirePro-US-oil-bounces-of-55-EMA-with-Hammer-formation-stay-long-on-close-above-110-EMA-1508943) is progressing well.
Recommendation: Hold for targets.
For details on FxWirePro's Currency Strength Index, visit http://www.fxwirepro.com/currencyindex.


