


 FxWirePro: USD/ZAR sustains gains as uptrend remains strong
  Euro Retreats as Geopolitical Tensions Surge: EURUSD Eyes 1.1400 Floor Amid Safe-Haven Demand
  Pound Under Pressure as Yen Stabilizes: GBPJPY Bears Target 208 as Key EMAs Hold Resistance
  FxWirePro- Woodies Pivot(Major)
  NZDJPY Bears Take Control: New Zealand Dollar Retreats as 92 Resistance Holds Firm
  FxWirePro- Major Crypto levels and bias summary
  FxWirePro- Major Crypto levels and bias summary
  FxWirePro: EUR/ NZD steadies around 2.0150, retains bid tone
  FxWirePro- Major Pair levels and bias summary
  FxWirePro: USD/CNY gains some ground but bearish outlook persists
  FxWirePro- Major Pair levels and bias summary
  FxWirePro: GBP/USD recovers but bears are not done yet again
  FxWirePro: USD/ZAR fibo rejection triggers sizeable pullback
  Aussie Retreats Against the Yen: AUDJPY Bears Target 108 as 110 Resistance Holds Firm
  FxWirePro: USD/JPY firms as Trump's address on Gulf war spark fresh concerns


 to see further weakness - EconoTimes)


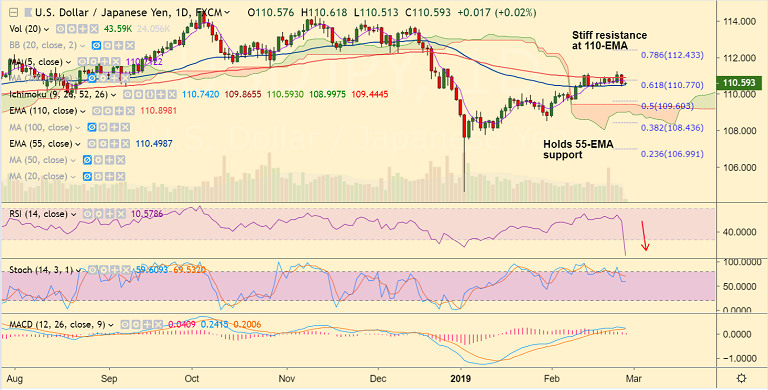
USD/JPY chart on Trading View used for analysis
- USD/JPY is trading in a narrow range, with session highs at 110.618 and lows at 110.513.
- The pair is consolidating previous session's slump after dovish Fed comments.
- On Tuesday, Fed Chair Powell reiterated patience on rate hikes and took note of the risks to the US economy.
- Both treasury yields and the US dollar weakened after Powell's dovish testimony and are expected to remain under pressure today.
- Technical indicators for the major are neutral to slightly bearish on the daily charts.
- Strong support is seen at 55-EMA at 110.50. Break below will accentuate weakness. Dip till daily cloud at 109.44 then likely.
- On the flipside 110-EMA at 110.90 is strong resistance. Upside only on decisive break above.
For details on FxWirePro's Currency Strength Index, visit http://www.fxwirepro.com/currencyindex.


