


 Euro Holds the Line: EURUSD Finds Support at the 365-EMA as Peace Talks Loom
  Bitcoin’s Islamabad Watch: BTCUSD Consolidates Near 71,421 USD as Geopolitical Peace Talks Loom
  NZDJPY Bulls Charge Toward 95.00: Safe-Haven Exodus Drives Kiwi Rally
  FxWirePro- Major Pair levels and bias summary
  FxWirePro: USD/CAD extends decline on broad dollar weakness
  FxWirePro: EUR/AUD under pressure as key support gives way
  FxWirePro: EUR/CAD gains ground on prospects of resumed energy flows
  FxWirePro- Woodies Pivot(Major)
  FxWirePro: USD/ZAR edges lower ,investors remain on edge
  FxWirePro: GBP/USD biased higher but rally currently stretched
  Aussie Consolidates After Peak: AUDJPY Bulls Eye a Strategic Entry for the 115.00 Target
  Kiwi Ascendant: NZDJPY Bulls Eye Multi-Year Peaks Amid Triple-Day Rally
  FxWirePro:NZD/USD continues to recovers , upside pressure builds
  FxWirePro: USD/JPY steadies around 158.75, bias bullish
  FxWirePro: USD/JPY holding bid into weekend
  Pound on Pause: GBPJPY Bulls Regroup for a Potential Sprint Toward 215.00


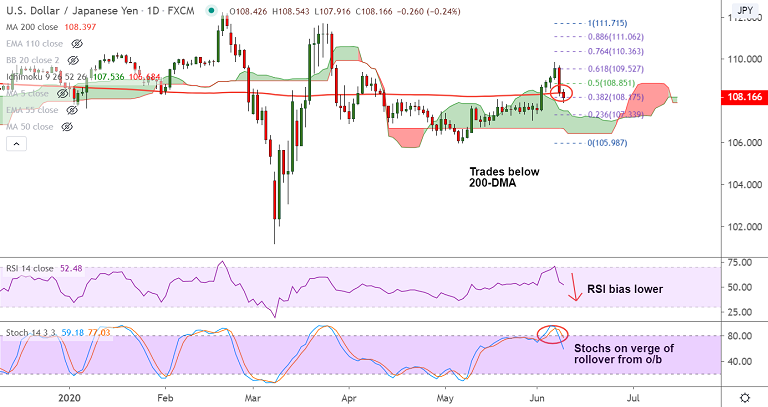
USD/JPY chart - Trading View
Fundamental Overview:
USD/JPY was trading 0.25% lower on the day at 108.16 at around 02:30 GMT. The pair showed a brief dip below 108 handle and has since pared some losses.
Shift in trading sentiment amid geopolitical tensions concerning Korea, Libya and China strengthen the Japanese yen. The US 10-year Treasury yields drop three basis points to 0.855%.
On the data front, Japan’s April month Labor Cash Earnings dropped to -0.6%, more than the forecasted 0.6%.
Traders now await Japan's May month preliminary Machine Tools Orders (due 06:00 GMT). U.S. inflation data due Wednesday is also likely to have a major impact.
Technical Analysis:
Technical indicators for the major are shifting bearish. Price action has slipped below 200-DMA and 200H MA. 2H 200 SMA is offering support at 107.97.
Oscillators paint a bearish picture. RSI is now biased lower and Stochs are on verge of rollover from overbought levels.
Ichimoku analysis shows Chikou Span is sharply lower. The pair is currently holding support at Kijun Sen at 107.91, break below will see more weakness.
Analysis of GMMA indicator shows major and minor trend have shifted strongly bearish on the hourly charts. And breach below 200H MA reinforces downside.
Summary: Pivot points are 2H 200 SMA and Kijun Sen at 109.97 and 107.91. Watch out for decisive break below to take short positions. Next hurdle for bears is cloud top at 107.53. Break below will see drag till lower Bollinger band at 106.52.


