


 FxWirePro: EUR/AUD gaining momentum for a move towards 1.6800 level
  NZDJPY Technical Outlook: Bearish Bias Deepens as Key Resistances Hold
  FxWirePro: USD/CAD runs out of steam but maintains bullish outlook
  Ethereum Rises on Geopolitical De-escalation: Pezeshkian’s Peace Signal Ignites Bullish Momentum
  FxWirePro- Woodies Pivot(Major)
  FxWirePro: USD/CNY gains some ground but bearish outlook persists
  FxWirePro- Major Pair levels and bias summary
  FxWirePro: USD/ZAR fibo rejection triggers sizeable pullback
  FxWirePro: USD/CNY dips as China’s yuan strengthens on Iran war de escalation hopes
  Bitcoin Recovers Amid Easing Geopolitics: Bulls Target USD 80,000 Support Rebound
  FxWirePro: AUD/USD downside pressure builds, key support level in focus
  FxWirePro: AUD/USD gains some ground but remains sensitive to Middle East tensions
  AUDJPY Pullback Intensifies: Resistance at 110.00 Signals Short Opportunity
  FxWirePro: EUR/AUD retreats slightly but trend is still bullish
  EUR/JPY Bulls Charge: Eyeing 186.00 as Euro Strength Intensifies


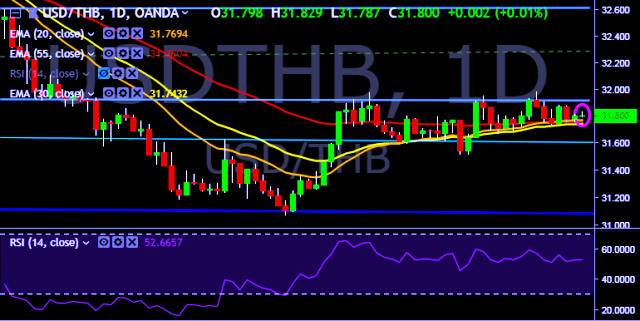
- USD/THB is currently trading around 31.80 marks.
- It made intraday high at 31.82 and low at 31.78 marks.
- Intraday bias remains neutral till the time pair holds key resistance at 31.92 mark.
- On the top side, key resistances are seen at 31.92, 32.02, 32.10, 32.22 and 32.54 marks respectively.
- Alternatively, a daily close below 31.70 will drag the parity down towards key supports around 31.58, 31.42, 31.28, 31.20 and 31.06 marks respectively.
- Important to note here that 20D, 30D and 55D EMA heads down and confirms the bearish trend in a daily chart.
We prefer to take long position on USD/THB only above 31.92, stop loss at 31.70 and target of 32.10.


