


 FxWirePro: USD/JPY firms as Trump's address on Gulf war spark fresh concerns
  FxWirePro: USD/ZAR fibo rejection triggers sizeable pullback
  FxWirePro: USD/CNY gains some ground but bearish outlook persists
  FxWirePro- Major Pair levels and bias summary
  FxWirePro- Woodies Pivot(Major)
  FxWirePro: GBP/USD outlook weaker on renewed downside pressure
  Euro Retreats as Geopolitical Tensions Surge: EURUSD Eyes 1.1400 Floor Amid Safe-Haven Demand
  FxWirePro- Woodies Pivot(Major)
  FxWirePro- Major Crypto levels and bias summary
  FxWirePro: USD/CAD runs out of steam but maintains bullish outlook
  FxWirePro: GBP/NZD range to extend until there is game changing news
  FxWirePro: GBP/USD recovers but bears are not done yet again
  FxWirePro:NZD/USD drifts lower, could be on verge of bigger drop
  FxWirePro: USD/ZAR sustains gains as uptrend remains strong
  Pound Under Pressure as Yen Stabilizes: GBPJPY Bears Target 208 as Key EMAs Hold Resistance


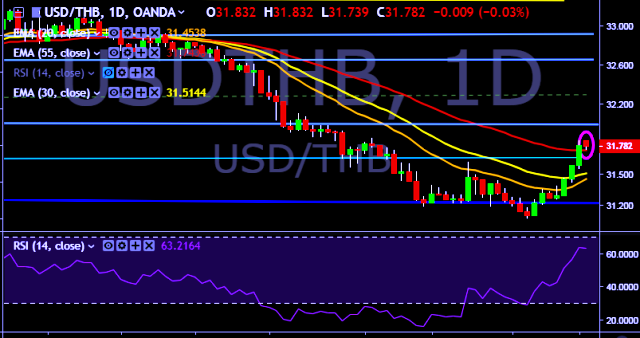
- USD/THB is currently trading around 31.78 marks.
- It made intraday high at 31.83 and low at 31.73 marks.
- Intraday bias remains neutral for the moment.
- On the top side, key resistances are seen at 31.93, 32.02 and 32.10 marks respectively.
- Alternatively, a daily close below 31.80 will drag the parity down towards key supports around 31.54, 31.42, 31.28, 31.20, 31.06, 30.94, 30.20 and 29.66 marks respectively.
- Important to note here that 20D, 30D and 55D EMA heads down and confirms the bearish trend in a daily chart.
We prefer to take long position on USD/THB only above 31.83, stop loss at 31.70 and target of 31.93/32.02 mark.


