


 FxWirePro: EUR/AUD gaining momentum for a move towards 1.6800 level
  FxWirePro- Major European Indices
  Ethereum Retreats Toward USD 2,000: Technicals Signal Caution as ETH Mimics Bitcoin’s Pullback
  FxWirePro: EUR/AUD eases slightly but trend is still bullish
  FxWirePro: AUD/USD downside pressure builds, key support level in focus
  FxWirePro- Major Crypto levels and bias summary
  FxWirePro: USD/CNY gains some ground but bearish outlook persists
  FxWirePro: GBP/NZD remains buoyant, looks to extend gains
  FxWirePro- Woodies Pivot(Major)
  Euro Retreats as Geopolitical Tensions Surge: EURUSD Eyes 1.1400 Floor Amid Safe-Haven Demand
  Aussie Retreats Against the Yen: AUDJPY Bears Target 108 as 110 Resistance Holds Firm
  FxWirePro- Major Pair levels and bias summary
  FxWirePro: EUR/ NZD consolidating around 2.0180 room for further gains
  FxWirePro- Major Pair levels and bias summary
  FxWirePro: USD/ZAR fibo rejection triggers sizeable pullback
  Pound Under Pressure as Yen Stabilizes: GBPJPY Bears Target 208 as Key EMAs Hold Resistance


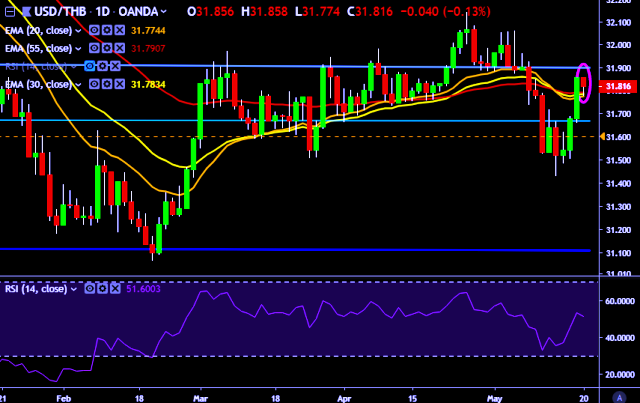
- USD/THB is currently trading around 31.81 marks.
- It made intraday high at 31.85 and low at 31.77 marks.
- Intraday bias remains bearish till the time pair holds key resistance at 31.85 mark.
- On the top side, key resistances are seen at 31.92, 32.10, 32.22 and 32.54 marks respectively.
- Alternatively, a daily close below 31.85 will drag the parity down towards key supports around 31.70, 31.40, 31.28, 31.20 and 31.06 marks respectively.
- Important to note here that 20D, 30D and 55D EMA heads down and confirms the bearish trend in a daily chart.
We prefer to take long position on USD/THB only above 31.90, stop loss at 31.70 and target of 32.22.


