


 FxWirePro: GBP/USD stuck in range but maintains bearish bias
  FxWirePro: EUR/ NZD downside pressure builds, key support level in focus
  FxWirePro- Major Crypto levels and bias summary
  EUR/JPY Breaks Out: Euro Surges Past 185.00 Resistance Amid Strong Bullish Momentum
  Ethereum Reclaims Higher Ground: Ether Bulls Target $2,700 as Middle East Tensions Thaw
  FxWirePro- Woodies Pivot(Major)
  GBPJPY Surges to 211.88: Sterling Bulls Target 215 Amid Broad-Based Buying
  FxWirePro: GBP/NZD reverses course, bias back to downside
  Pound Sterling Power: GBP/JPY Secures Third Day of Gains as Global Risk Tensions Recede
  FxWirePro- Woodies Pivot(Major)
  FxWirePro- Major Pair levels and bias summary
  Aussie Ascent: AUDJPY Charges Toward 112 as Bullish Momentum Hits Five-Day High
  Bitcoin's Tug-of-War: Bulls Eye 80,000 USD Despite Turbulent ETF Outflows
  FxWirePro- Major European Indices
  Aussie Bulls Charge: AUD/JPY Rallies as Geopolitical Clouds Part
  FxWirePro: GBP/AUD downtrend extends, eyes 1.8900 evel


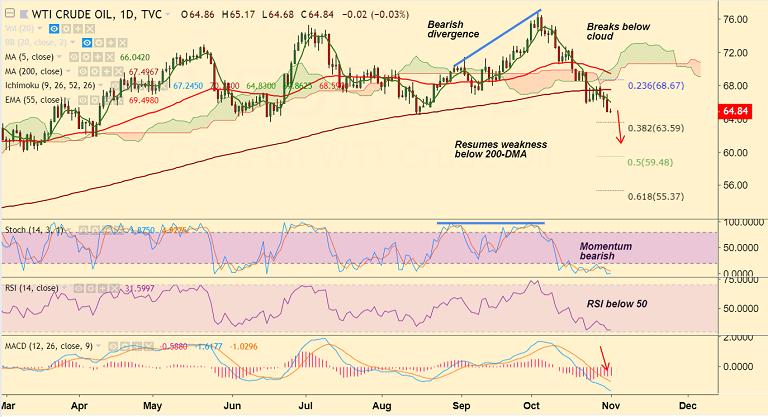
US oil chart on Trading View used for analysis
- US oil is trading in an extremely narrow range, capped below $65 per barrel mark.
- Rising US crude supplies combined with global growth concerns continue to undermine the sentiment.
- Markets remain wary about the global economic slowdown fears amid ongoing US-China trade war and the European political woes.
- Further, the US EIA data showed that the US crude oil inventories climbed for a sixth straight week.
- The pair is extending break below 200-DMA and now targets next major support at 38.2% Fib at 64.94.
- Technical studies support weakness, momentum studies are bearish. Break below 38.2% Fib to extend weakness.
Support levels - 63.59 (38.2% Fib), 61.84 (Apr 6 low)
Resistance levels - 66.07 (5-DMA), 67.49 (200-DMA)
For details on FxWirePro's Currency Strength Index, visit http://www.fxwirepro.com/currencyindex.


