


 FxWirePro- Major Pair levels and bias summary
  Euro’s Shine Fades: Intraday Breakdown Eyes the 1.1400 Support Floor
  FxWirePro:NZD/USD edges higher but bearish outlook persists
  FxWirePro: EUR/NZD strengthens as New Zealand Dollar weakens after disappointing GDP data
  FxWirePro- Woodies Pivot(Major)
  NZDJPY Under Pressure: Kiwi Slump Eyes 90.85 as Technicals Turn Bearish
  Ethereum Braces for $3,000: Bullish Momentum Eyes Next Major Breakout
  Bitcoin Buffeted by Fed Hawkishness: BTCUSD Slips to USD 69,500 Amid Risk-Off Shift
  FxWirePro: GBP/NZD bulls struggles as upside momentum fades
  FxWirePro: GBP/USD downside pressure builds, key support level in focus
  Bitcoin Consolidation Phase: BTCUSD Holds Support at USD 74,202 as Bulls Target USD 80,000
  NZDJPY Under Pressure: Kiwi Slump Eyes 90.85 as Technicals Turn Bearish
  AUDJPY Bull Run: Three-Day Rally Eyes the 115.00 Milestone
  FxWirePro: USD/CAD positions for another climb, eyes 1.3800 level
  Gold Cracks USD 5,000: Safe-Haven Exodus Triggers Major Technical Breakdown
  Bitcoin Consolidation Phase: BTCUSD Holds Support at USD 74,202 as Bulls Target USD 80,000


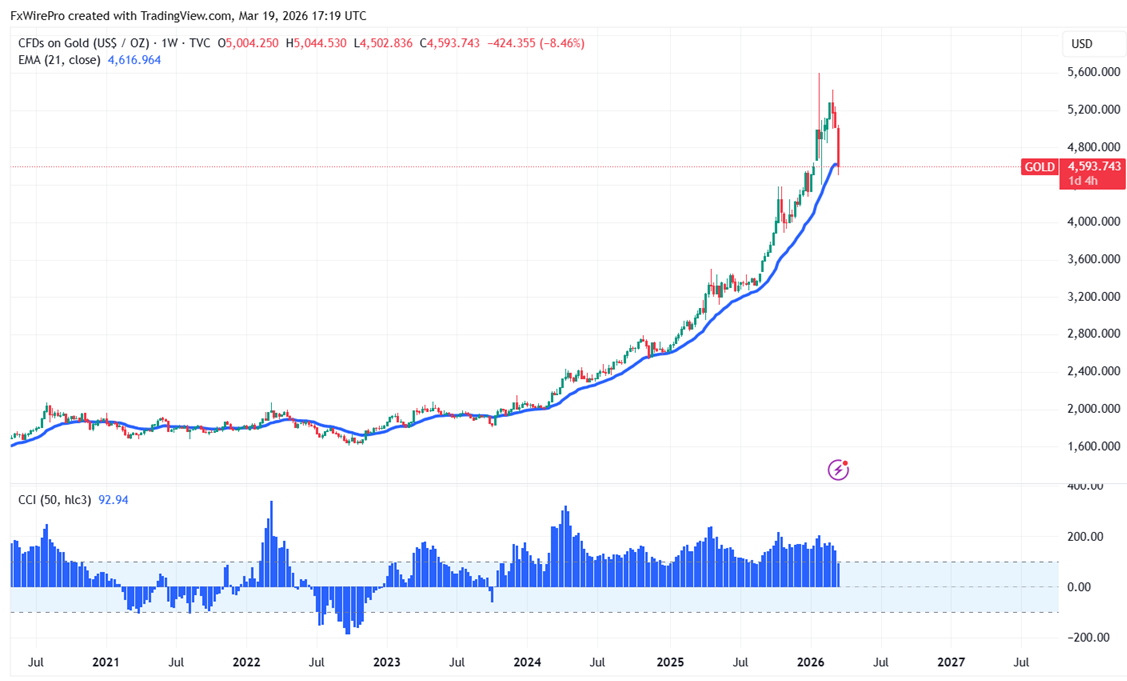
Gold lost its shine after the hawkish tone by the Fed. After hitting a peak around $5415, it’s currently hovering near $4593.
As of March 19, 2026, gold has experienced a notable technical decline, trading around USD 4,616 per ounce. For the first time in over two and a half years, it dropped decisively below its 21-week Exponential Moving Average, which sits near USD 5,034. This represents about an 8.3% gap below that average, marking the most prolonged period of underperformance since late 2023. This shift effectively reverses the momentum from a multi-year rally that reached its peak at USD 5,608 back in January. The main forces behind this downturn appear to be a renewed strength in the US Dollar and central banks signaling they will maintain higher interest rates for a longer period, moving away from earlier expectations of cuts.
|
Technicals |
CMP -$4593 |
Trend |
|
|
Weekly chart |
Value |
|
|
|
21 EMA |
$4619 |
CMP < 55 EMA |
Bearish |
|
55- EMA |
$3968 |
CMP > 200- EMA |
Bullish |
|
200- EMA |
$2879 |
CMP >365 EMA |
Bullish |
Major support- $4400 (Feb 2nd 2026). Major bearishness below $4400. Any violation below targets $4000/$3605.
|
Momentum indicator (Daily chart) |
Inference |
Value |
|
CCI(50) |
Bearish |
-24.86 |
|
ADX |
Bearish |
Strength increased from 15.07 to 18 |
It is good to sell on rallies around $4728-30 with SL around $5000 for a TP of $4000/$3600.


